
Mathematics, 02.07.2021 05:50 nickddj12
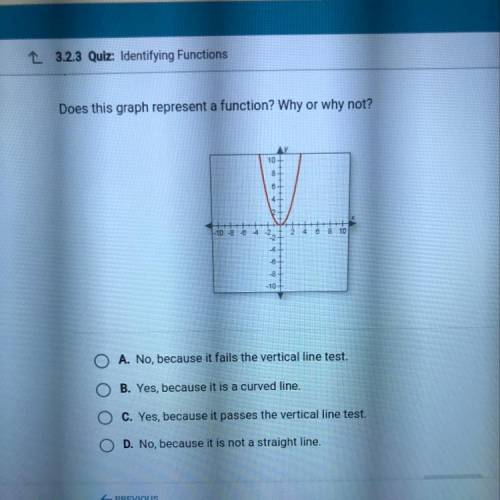
Does this graph represent a function? Why or why not?
A. No, because it fails the vertical line test.
B. Yes, because it is a curved line.
C. Yes, because it passes the vertical line test.
D. No, because it is not a straight line.

Answers: 2


Another question on Mathematics
Mathematics, 21.06.2019 20:00
Someone answer asap for ! max recorded the heights of 500 male humans. he found that the heights were normally distributed around a mean of 177 centimeters. which statements about max’s data must be true? a. the median of max’s data is 250 b. more than half of the data points max recorded were 177 centimeters. c. a data point chosen at random is as likely to be above the mean as it is to be below the mean. d. every height within three standard deviations of the mean is equally likely to be chosen if a data point is selected at random.
Answers: 1
Mathematics, 21.06.2019 20:30
Adecorative window is made up of a rectangle with semicircles at either end. the ratio of ad to ab is 3: 2 and ab is 30 inches. what is the ratio of the area of the rectangle to the combined area of the semicircles? possible answers: a. 2: 3 b. 3: 2 c. 6: π d. 9: π e. 30: π
Answers: 1
Mathematics, 21.06.2019 21:00
Which of the functions graphed below has a removable discontinuity?
Answers: 2
Mathematics, 22.06.2019 00:20
Abag contains pieces of paper numbered from 5 to 9. a piece of paper is drawn at random. what is the theoretical probability of drawing a number less than 8?
Answers: 1
You know the right answer?
Does this graph represent a function? Why or why not?
A. No, because it fails the vertical line tes...
Questions
Mathematics, 19.02.2021 05:00

English, 19.02.2021 05:00

Computers and Technology, 19.02.2021 05:00
Mathematics, 19.02.2021 05:00


History, 19.02.2021 05:00

Chemistry, 19.02.2021 05:00
History, 19.02.2021 05:00
Mathematics, 19.02.2021 05:00
Mathematics, 19.02.2021 05:00

Advanced Placement (AP), 19.02.2021 05:00


