
Mathematics, 02.05.2021 03:40 10801652
A survey of a group of seventh-graders and a group of teachers at a local middle school asked how many siblings they each have. The dot plots below show the results.
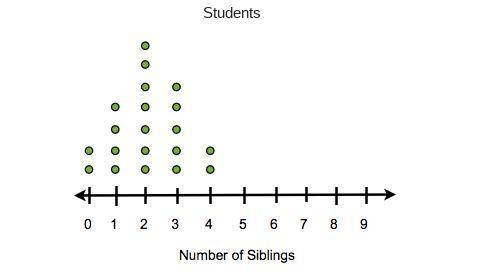
Students
A dot plot titled Students. A number line going from 0 to 9 labeled the number of siblings. There are 2 dots above 0, 4 above 1, 7 above 2, 5 above 3, 2 above 4, and 0 above 5, 6, 7, 8, and 9.
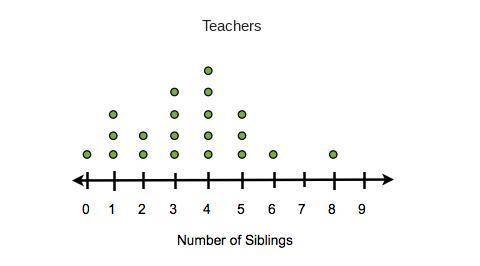
Teachers
A dot plot titled Teachers. A number line going from 0 to 9 labeled Number of siblings. There is 1 dot above 0, 3 dots above 1, 2 above 2, 4 above 3, 5 above 4, 3 above 5, 1 above 6, 0 above 7, 1 above 8, and 0 above 9.
Based on the shape of the two-dot plots, which statements correctly compare them? Select three choices.
The center of the data for students has a value less than that of the center of the data for teachers.
The center of the data is to the right of the dot plot for both teachers and students.
There is a greater variation in the data for teachers than for students.
Both sets of data cluster around 2.
The same number of teachers as students were surveyed.
i need the ASAP!!!

Answers: 2


Another question on Mathematics
Mathematics, 21.06.2019 18:00
Adj has a total of 1075 dance and rock songs on her system. the dance selection is 4 times the size of the rock selection. write a system of equations to represent the situation.
Answers: 1
Mathematics, 21.06.2019 20:30
Martha has a deck of cards. she has lost some of the cards, and now the deck only contains nine spades, eleven diamonds, eight clubs, and twelve hearts. martha predicts that whenever she draws a card from the deck without looking, she will draw a club one-fifth of the time. which activity would best allow martha to test her prediction? a. randomly draw a card from the box and see if it is a club. b. randomly draw a card. then, continue to draw another card until all eight clubs are drawn. c. randomly draw and replace a card 120 times. then, observe how close to 30 times a club is drawn. d. randomly draw and replace a card 100 times. then, observe how close to 20 times a club is drawn.
Answers: 3
Mathematics, 21.06.2019 23:50
Write the standard form of an equation with (see picture below)
Answers: 2
You know the right answer?
A survey of a group of seventh-graders and a group of teachers at a local middle school asked how ma...
Questions

History, 12.08.2020 08:01
Mathematics, 12.08.2020 08:01


Physics, 12.08.2020 08:01
Mathematics, 12.08.2020 08:01

Mathematics, 12.08.2020 08:01
Mathematics, 12.08.2020 08:01

Mathematics, 12.08.2020 08:01


