plot below

Mathematics, 21.04.2021 21:10 victoriadorvilu
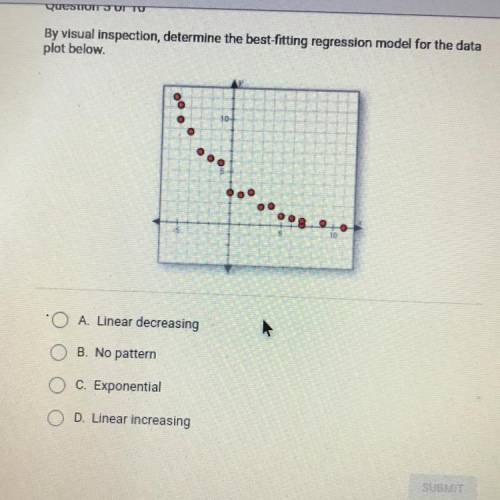
By visual inspection, determine the best fitting regression model for the data
plot below

Answers: 1


Another question on Mathematics
Mathematics, 21.06.2019 13:00
The graph shows the prices of different numbers of bushels of corn at a store in the current year. the table shows the prices of different numbers of bushels of corn at the same store in the previous year. previous year number of bushels price of corn (dollars) 2 10 4 20 6 30 8 40 part a: describe in words how you can find the rate of change of a bushel of corn in the current year, and find the value. part b: how many dollars more is the price of a bushel of corn in the current year than the price of a bushel of corn in the previous year? show your work.
Answers: 1
Mathematics, 21.06.2019 14:30
Which expression is equivalent to (3^2)^-2 a.-81 b.-12 c.1/81 d.1/12
Answers: 2
Mathematics, 21.06.2019 19:00
Since opening night, attendance at play a has increased steadily, while attendance at play b first rose and then fell. equations modeling the daily attendance y at each play are shown below, where x is the number of days since opening night. on what day(s) was the attendance the same at both plays? what was the attendance? play a: y = 8x + 191 play b: y = -x^2 + 26x + 126 a. the attendance was never the same at both plays. b. the attendance was the same on day 5. the attendance was 231 at both plays on that day. c. the attendance was the same on day 13. the attendance was 295 at both plays on that day. d. the attendance was the same on days 5 and 13. the attendance at both plays on those days was 231 and 295 respectively.
Answers: 1
Mathematics, 21.06.2019 21:30
High school seniors with strong academic records apply to the nation’s most selective colleges in greater numbers each year. because the number of slots remains relatively stable, some colleges reject more early applicants. suppose that for a recent admissions class, an ivy league college received 2851 applications for early admission. of this group, it admitted 1033 students early, rejected 854 outright, and deferred 964 to the regular admission pool for further consideration. in the past, this school has admitted 18% of the deferred early admission applicants during the regular admission process. counting the students admitted early and the students admitted during the regular admission process, the total class size was 2375. let e, r, and d represent the events that a student who applies for early admission is admitted early, rejected outright, or deferred to the regular admissions pool.suppose a student applies for early admission. what is the probability that the student will be admitted for early admission or be deferred and later admitted during the regular admission process?
Answers: 3
You know the right answer?
By visual inspection, determine the best fitting regression model for the data
plot below
plot below
Questions
Mathematics, 10.10.2020 19:01

Mathematics, 10.10.2020 19:01

Mathematics, 10.10.2020 19:01


English, 10.10.2020 19:01


