
Mathematics, 10.10.2020 19:01 ahhhhhhhh2806
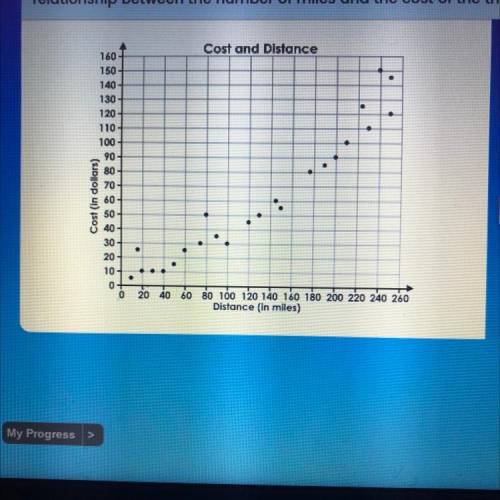
The graph of an equation drawn through which two points would best represent the
relationship between the number of miles and the cost of the trip?
The options are
(15,25) and (240,150)
(40,10) and (250,145)
(60,25) and (240,150)
(10,5) and (250,120)

Answers: 3


Another question on Mathematics
Mathematics, 21.06.2019 17:30
Choose the number sentence that shows the identity property of addition. a. 122 = 61 + 61 b. 62 = 1 + 61 c. 61 = 0 + 61
Answers: 1
Mathematics, 21.06.2019 18:00
The brain volumes (cm cubed) of 50 brains vary from a low of 904 cm cubed to a high of 1488 cm cubed. use the range rule of thumb to estimate the standard deviation s and compare the result to the exact standard deviation of 175.5 cm cubed, assuming the estimate is accurate if it is within 15 cm cubed
Answers: 2
Mathematics, 21.06.2019 19:30
The wheels of a bicycle have a diameter of 70cm. how many meters will the bicycle travel if each wheel makes 50 revolutions
Answers: 2
Mathematics, 21.06.2019 20:30
Two angles are complementary. the larger angle is 36 more than the smaller angle. what is the measure of the larger angle?
Answers: 2
You know the right answer?
The graph of an equation drawn through which two points would best represent the
relationship betwe...
Questions


Business, 03.03.2020 06:05
Mathematics, 03.03.2020 06:05


Computers and Technology, 03.03.2020 06:05

History, 03.03.2020 06:05
Mathematics, 03.03.2020 06:05
Mathematics, 03.03.2020 06:05


Computers and Technology, 03.03.2020 06:05


