
Mathematics, 20.10.2019 17:00 kinglightskin2k
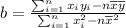
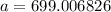
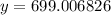
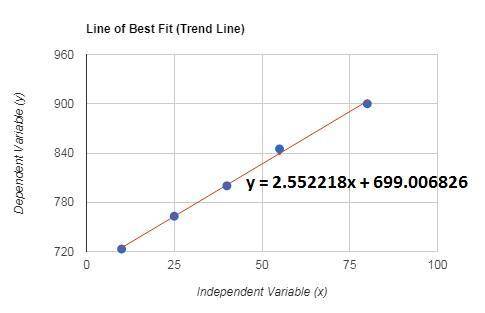
1) the data in the table below represents the pressure of the gas as the temperature changes. plot a graph of the data, using the space below. draw a trend line and calculate its slope. how are the variables related? what will he pressure of the gas be at 0c?
the graph looks like this
temperature pressure
10 723
25 763
40 800
55 845
80 900

Answers: 1


Another question on Mathematics
Mathematics, 20.06.2019 18:02
Ineed with 14, 16, 28 and 36 me. we didn't go over them in class so i don't know what to do.
Answers: 1
Mathematics, 21.06.2019 19:30
Find the actual dimensions of the box. the side length are in meters and integers. the surface area of the box is 104 m2 and volume of the box is 60 m3.
Answers: 1
Mathematics, 22.06.2019 03:20
Arepresentative from plan 1 wants to use the graph below to sell health plans for his company. how might the graph be redrawn to emphasize the difference between the cost per doctor visit for each of the three plans? the scale on the y-axis could be changed to 0–100. the scale on the y-axis could be changed to 25–40. the interval of the y-axis could be changed to count by 5s. the interval of the y-axis could be changed to count by 20s.
Answers: 2
You know the right answer?
1) the data in the table below represents the pressure of the gas as the temperature changes. plot a...
Questions


Computers and Technology, 20.01.2020 23:31


Biology, 20.01.2020 23:31


