
Mathematics, 12.04.2021 16:20 ava5015
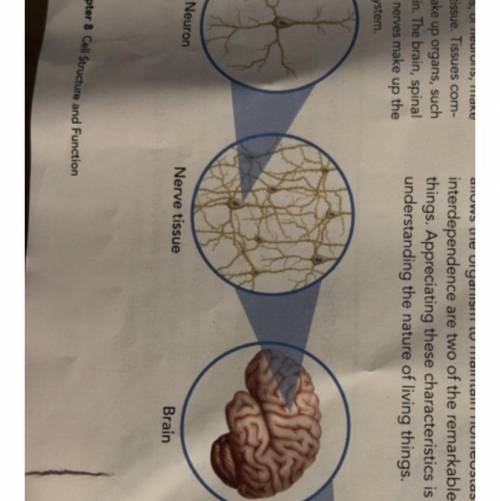
review figure 8-23 how well does a diagram represents the levels of organization of multicellular organisms? how could the model be improved? 

Answers: 1


Another question on Mathematics
Mathematics, 21.06.2019 19:00
Since opening night, attendance at play a has increased steadily, while attendance at play b first rose and then fell. equations modeling the daily attendance y at each play are shown below, where x is the number of days since opening night. on what day(s) was the attendance the same at both plays? what was the attendance? play a: y = 8x + 191 play b: y = -x^2 + 26x + 126 a. the attendance was never the same at both plays. b. the attendance was the same on day 5. the attendance was 231 at both plays on that day. c. the attendance was the same on day 13. the attendance was 295 at both plays on that day. d. the attendance was the same on days 5 and 13. the attendance at both plays on those days was 231 and 295 respectively.
Answers: 1
Mathematics, 21.06.2019 19:30
Now max recorded the heights of 500 male humans. he found that the heights were normally distributed around a mean of 177 centimeters. which statements about max’s data must be true? a) the median of max’s data is 250 b) more than half of the data points max recorded were 177 centimeters. c) a data point chosen at random is as likely to be above the mean as it is to be below the mean. d) every height within three standard deviations of the mean is equally likely to be chosen if a data point is selected at random.
Answers: 1
Mathematics, 21.06.2019 20:00
Aclothing store has the sign shown in the shop window. pani sees the sign and wants to buy 3 shirts and 2 pairs of jeans. the cost of each shirt before the discount is $12, and the cost of each pair of jeans is $19 before the discount. write and simplify an expression to find the amount pani pays if a $3 discount is applied to her total
Answers: 2
Mathematics, 21.06.2019 21:30
Questions 9-10. use the table of educational expenditures to answer the questions. k-12 education expenditures population indiana $9.97 billion 6.6 million illinois $28.54 billion 12.9 million kentucky $6.58 billion 4.4 million michigan $16.85 billion 9.9 million ohio $20.23 billion 11.6million 9. if the amount of k-12 education expenses in indiana were proportional to those in ohio, what would have been the expected value of k-12 expenditures in indiana? (give the answer in billions rounded to the nearest hundredth) 10. use the value of k-12 education expenditures in michigan as a proportion of the population in michigan to estimate what the value of k-12 education expenses would be in illinois. a) find the expected value of k-12 expenditures in illinois if illinois were proportional to michigan. (give the answer in billions rounded to the nearest hundredth) b) how does this compare to the actual value for k-12 expenditures in illinois? (lower, higher, same? )
Answers: 1
You know the right answer?
review figure 8-23 how well does a diagram represents the levels of organization of multicellular or...
Questions


Biology, 19.07.2021 18:50

English, 19.07.2021 18:50
Mathematics, 19.07.2021 18:50


Engineering, 19.07.2021 18:50

Computers and Technology, 19.07.2021 18:50
Computers and Technology, 19.07.2021 18:50


