
Mathematics, 20.03.2021 01:00 Emptypockets451
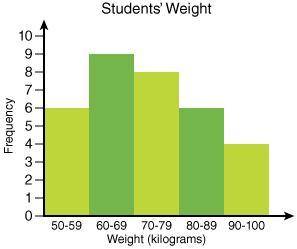
What would be the best way to display the data below to see specific data but still see the shape of the data?
line plot
bar graph
line graph
stem-and-leaf graph

Answers: 1


Another question on Mathematics
Mathematics, 21.06.2019 16:30
Problem melissa is her dad build a walkway in their backyard. the walkway will be 54 feet long and 1.5 feet wide. the local hardware store sells tiles which are 1.5 by 1.5 feet and come in boxes of 12. how many boxes of tiles do they need?
Answers: 1
Mathematics, 21.06.2019 19:30
The first floor of marcus’ house is 1,440 square feet. he will cover 1,033 square feet with wood and the rest with tile. a box of tiles will cover 11 square feet. how many boxes of tile does marcus need to buy to cover the floor?
Answers: 1
Mathematics, 21.06.2019 23:00
Suppose that 15 inches of wire cost 60 cents. at the same rate, how much (in cents) will 12 inches of wire cost
Answers: 2
Mathematics, 21.06.2019 23:30
If you measured the width of a window in inches and then in feet with measurement would you have the greater number of units
Answers: 3
You know the right answer?
What would be the best way to display the data below to see specific data but still see the shape of...
Questions
Mathematics, 29.11.2021 16:00

Chemistry, 29.11.2021 16:00


Mathematics, 29.11.2021 16:10

English, 29.11.2021 16:10
English, 29.11.2021 16:10
English, 29.11.2021 16:10
Mathematics, 29.11.2021 16:10
Mathematics, 29.11.2021 16:10

Chemistry, 29.11.2021 16:10

Law, 29.11.2021 16:10
English, 29.11.2021 16:10


