
Mathematics, 10.03.2021 20:20 ijohnh14
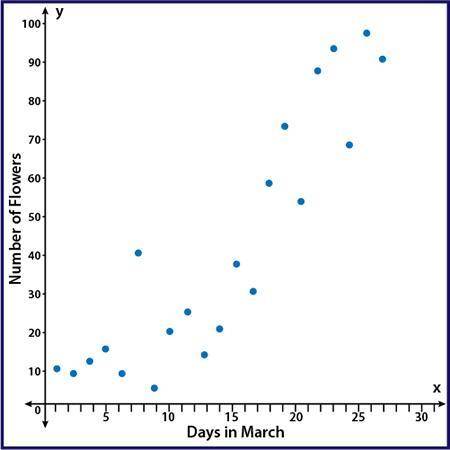
The scatter plot shows the number of flowers that have bloomed in the garden during the month of March:
A scatter plot with points showing an upward trend with points that are moderately spread out from a line of best fit. The y axis is labeled Number of Flowers and the x axis is labeled Days in March
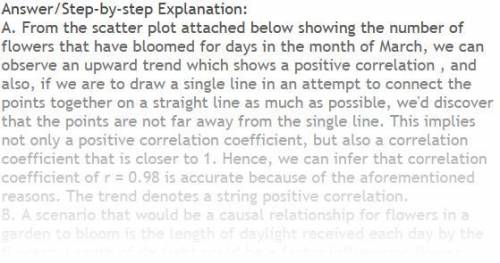
Part A: Using computer software, a correlation coefficient of r = 0.98 was calculated. Based on the scatter plot, is that an accurate value for this data? Why or why not? (5 points)
Part B: Instead of comparing the number of flowers and the day in March, write a scenario that would be a causal relationship for flowers in a garden. (5 points)

Answers: 3


Another question on Mathematics
Mathematics, 21.06.2019 23:30
Which equation represents a direct linear variationa. y=x2b. y=2/5xc. y=1/xd. y=x+3
Answers: 3
Mathematics, 21.06.2019 23:30
Select all expressions that are equivalent to 2(3x + 7y). question 1 options: 6x + 14y 6x + 7y 1(6x + 14y)
Answers: 3
You know the right answer?
The scatter plot shows the number of flowers that have bloomed in the garden during the month of Mar...
Questions


