
Mathematics, 03.11.2020 01:00 rissaroo159
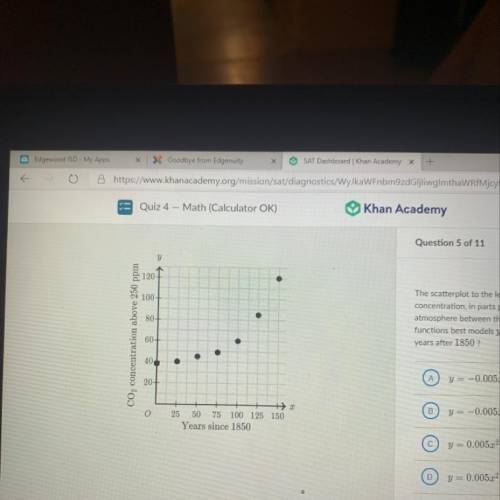
The scatterplot to the left depicts the carbon dioxide (CO2)
concentration, in parts per million (ppm) above 250 ppm, in Earth's
atmosphere between the years 1850 and 2000. Which of the following
functions best models y, the CO2 concentration above 250 ppm, 3
years after 1850 ?
y = -0.00522 - 0.296x - 39.430
y = -0.00522 - 0.296x + 39.430
y = 0.005x2 - 0.2962 – 39.430
y = 0.005x2 - 0.2962 + 39.430
I would be guessing.

Answers: 3


Another question on Mathematics
Mathematics, 21.06.2019 17:00
Segment xy is dilated through point m with a scale factor of 2. which segment shows the correct result of the dilation
Answers: 1
Mathematics, 21.06.2019 23:30
Afactory buys 10% of its components from suppliers b and the rest from supplier c. it is known that 6% of the components it buys are faulty. of the components brought from suppliers a,9% are faulty and of the components bought from suppliers b, 3% are faulty. find the percentage of components bought from supplier c that are faulty.
Answers: 1
Mathematics, 22.06.2019 00:10
Me its important ! marge runs an ice cream parlor. her speciality is triple chocolate sundaes.she can prepare 1 sundae every 2 minutes, and she earns $1.20 for each sundae she makes . if she just makes sundaes for a single shift of at most 4 hours and at least 2 hours , which function relates her earnings to the number of minutes she works?
Answers: 2
You know the right answer?
The scatterplot to the left depicts the carbon dioxide (CO2)
concentration, in parts per million (p...
Questions

History, 17.06.2020 10:57
Mathematics, 17.06.2020 10:57
Mathematics, 17.06.2020 10:57

Mathematics, 17.06.2020 10:57

Computers and Technology, 17.06.2020 10:57

Chemistry, 17.06.2020 10:57

Mathematics, 17.06.2020 10:57

Mathematics, 17.06.2020 10:57


