= CPM CCA 212
Clarissa Coriquez
<
15 12
Next >
y
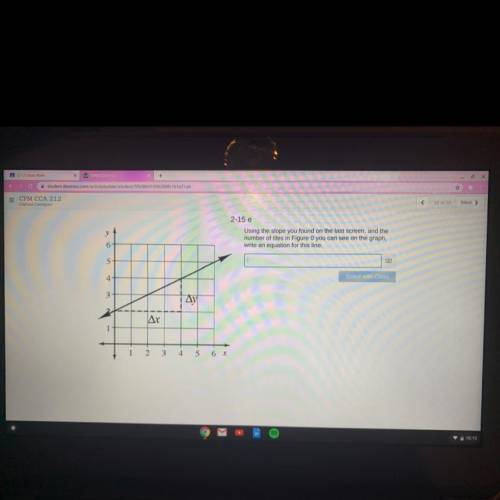
2-15 e
U...

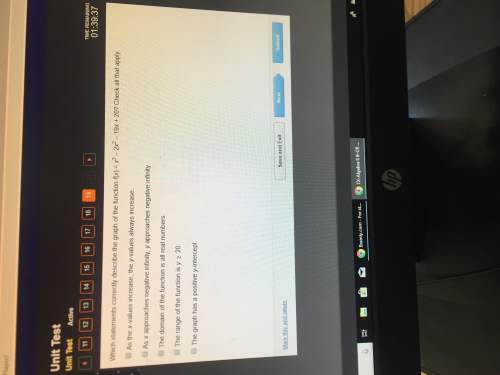
Mathematics, 02.10.2020 15:01 cristabean87
= CPM CCA 212
Clarissa Coriquez
<
15 12
Next >
y
2-15 e
Using the slope you found on the last screen, and the
number of tiles in Figure o you can see on the graph,
write an equation for this line.
5
Share with Class
4
3 2
Ay
Ar
1 2 3 4 5 6 x

Answers: 3


Another question on Mathematics
Mathematics, 21.06.2019 20:00
Someone answer asap for ! max recorded the heights of 500 male humans. he found that the heights were normally distributed around a mean of 177 centimeters. which statements about max’s data must be true? a. the median of max’s data is 250 b. more than half of the data points max recorded were 177 centimeters. c. a data point chosen at random is as likely to be above the mean as it is to be below the mean. d. every height within three standard deviations of the mean is equally likely to be chosen if a data point is selected at random.
Answers: 1
Mathematics, 21.06.2019 21:00
Isabel graphed the following system of equations. 2x – y = 6 y = -3x + 4 she came up with the solution (2,-2). what were the 3 steps she did to get that solution? (make sure they are in the correct order)
Answers: 2
Mathematics, 21.06.2019 22:20
In a young single person's monthly budget, $150 is spent on food, $175 is spent on housing, and $175 is spend on other items. suppose you drew a circle graph to represent this information, what percent of the graph represents housing?
Answers: 1
Mathematics, 21.06.2019 22:30
Assume that y varies inversely with x. if y=1.6 when x=0.5 find x when y=3.2 acellus answer
Answers: 2
You know the right answer?
Questions


Computers and Technology, 13.09.2019 17:10

World Languages, 13.09.2019 17:10
Mathematics, 13.09.2019 17:10


Physics, 13.09.2019 17:10

Mathematics, 13.09.2019 17:10

Business, 13.09.2019 17:10
Health, 13.09.2019 17:10
Mathematics, 13.09.2019 17:10


Geography, 13.09.2019 17:10
Social Studies, 13.09.2019 17:10


