
Mathematics, 21.07.2020 01:01 davisnaziyahovz5sk
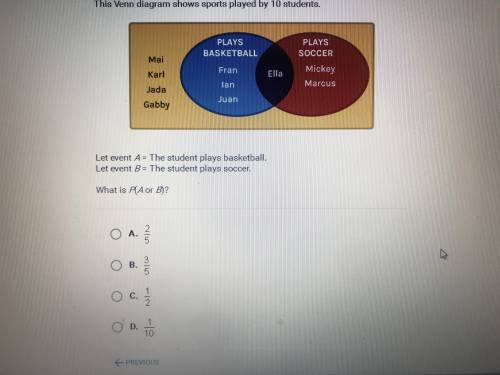
this Venn diagram shows was played by 10 students let event A = was the same play basketball like even see it with a student play soccer what is a P(A OR B)

Answers: 3


Another question on Mathematics
Mathematics, 21.06.2019 13:10
In the surface area formula for cylinders which expressionrepresents the lateral area
Answers: 1
Mathematics, 21.06.2019 14:30
anyone? find the second, fifth, and ninth terms of a sequence where the first term is 65 and the common difference is -7. 72, 93, 121 72, 79, 86 58, 37, 9 58, 51, 44
Answers: 1
Mathematics, 21.06.2019 19:40
It appears that people who are mildly obese are less active than leaner people. one study looked at the average number of minutes per day that people spend standing or walking. among mildly obese people, the mean number of minutes of daily activity (standing or walking) is approximately normally distributed with mean 376 minutes and standard deviation 64 minutes. the mean number of minutes of daily activity for lean people is approximately normally distributed with mean 528 minutes and standard deviation 107 minutes. a researcher records the minutes of activity for an srs of 7 mildly obese people and an srs of 7 lean people. use z-scores rounded to two decimal places to answer the following: what is the probability (image for it appears that people who are mildly obese are less active than leaner people. one study looked at the averag0.0001) that the mean number of minutes of daily activity of the 6 mildly obese people exceeds 420 minutes? what is the probability (image for it appears that people who are mildly obese are less active than leaner people. one study looked at the averag0.0001) that the mean number of minutes of daily activity of the 6 lean people exceeds 420 minutes?
Answers: 1
Mathematics, 22.06.2019 00:10
2. (09.01 lc) a function is shown in the table. x g(x) −3 17 −1 −3 0 −4 2 13 which of the following is a true statement for this function? (5 points) the function is increasing from x = −3 to x = −1. the function is increasing from x = −1 to x = 0. the function is decreasing from x = 0 to x = 2. the function is decreasing from x = −3 to x = −1.
Answers: 3
You know the right answer?
this Venn diagram shows was played by 10 students let event A = was the same play basketball like ev...
Questions

Biology, 28.01.2022 17:20
Mathematics, 28.01.2022 17:20
Mathematics, 28.01.2022 17:20


History, 28.01.2022 17:20

Social Studies, 28.01.2022 17:20
Mathematics, 28.01.2022 17:20
Mathematics, 28.01.2022 17:20
Mathematics, 28.01.2022 17:20

Physics, 28.01.2022 17:20
English, 28.01.2022 17:20

Chemistry, 28.01.2022 17:20


