
Mathematics, 13.07.2020 23:01 amychan123
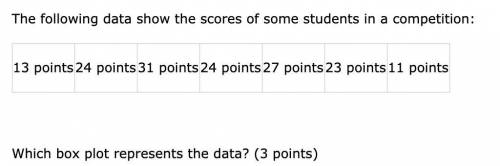
The following data show the scores of some students in a competition: 13 points 24 points 31 points 24 points 27 points 23 points 11 points Which box plot represents the data? (3 points) A box plot titled 'Scores of Participants' and labeled 'Score' uses a number line from 10 to 35 with primary markings and labels at 10, 15, 20, 25, 30, and 35. The box extends from 23 to 27 on the number line. A line in the box is at 24. The whiskers end at 11 and 31. A box plot titled 'Scores of Participants' and labeled 'Score' uses a number line from 10 to 35 with primary markings and labels at 10, 15, 20, 25, 30, and 35. The box extends from 13 to 27 on the number line. A line in the box is at 24. The whiskers end at 11 and 31. A box plot titled 'Scores of Participants' and labeled 'Score' uses a number line from 10 to 35 with primary markings and labels at 10, 15, 20, 25, 30, and 35. The box extends from 13 to 27 on the number line. A line in the box is at 23. The whiskers end at 11 and 31. A box plot titled 'Scores of Participants' and labeled 'Score' uses a number line from 10 to 35 with primary markings and labels at 10, 15, 20, 25, 30, and 35. The box extends from 13 to 27 on the number line. A line in the box is at 24. The whiskers end at 10 and 35

Answers: 1


Another question on Mathematics
Mathematics, 21.06.2019 16:20
Giuseppi's pizza had orders for $931.00 of pizzas. the prices were $21 for a large pizza, 514 for a medium pizza, and $7 for a small pizza. the number of large pizzas was two less than four times the number of medium pizzas. thenumber of small pizzas was three more than three times the number of medium pizzas. how many of each size of pizza were ordered?
Answers: 1
Mathematics, 21.06.2019 18:30
At the olympic games, many events have several rounds of competition. one of these events is the men's 100-meter backstroke. the upper dot plot shows the times (in seconds) of the top 8 finishers in the final round of the 2012 olympics. the lower dot plot shows the times of the same 8 swimmers, but in the semifinal round. which pieces of information can be gathered from these dot plots? (remember that lower swim times are faster.) choose all answers that apply: a: the swimmers had faster times on average in the final round. b: the times in the final round vary noticeably more than the times in the semifinal round. c: none of the above.
Answers: 2
Mathematics, 21.06.2019 20:00
Find the least common multiple of the expressions: 1. 3x^2, 6x - 18 2. 5x, 5x(x +2) 3. x^2 - 9, x + 3 4. x^2 - 3x - 10, x + 2 explain if possible
Answers: 1
Mathematics, 22.06.2019 00:00
Mila's dog weighs 4 pounds more than 8 times the weight of keiko's dog. which expression could be used to fine te weight of mila's dog?
Answers: 2
You know the right answer?
The following data show the scores of some students in a competition: 13 points 24 points 31 points...
Questions

Biology, 30.03.2020 22:41


Mathematics, 30.03.2020 22:42
Mathematics, 30.03.2020 22:42

English, 30.03.2020 22:42
English, 30.03.2020 22:42
Mathematics, 30.03.2020 22:42
Business, 30.03.2020 22:42

Mathematics, 30.03.2020 22:42

Computers and Technology, 30.03.2020 22:42


