
Mathematics, 11.03.2020 02:22 nene3210204
Do humans have free will or are we hamstrung by greater forces (or even ourselves!)? Let's find out. Say aloud the colors you see for the below text (see PDF for colored text):
List 1: house goodbye paper cow clown eat ...
List 2: yellow green orange white purple black ...
If you're like most people, List 2 was harder. This is known as the Stroop effect, and it sug- gests that your own mind might block you from your goals in life.
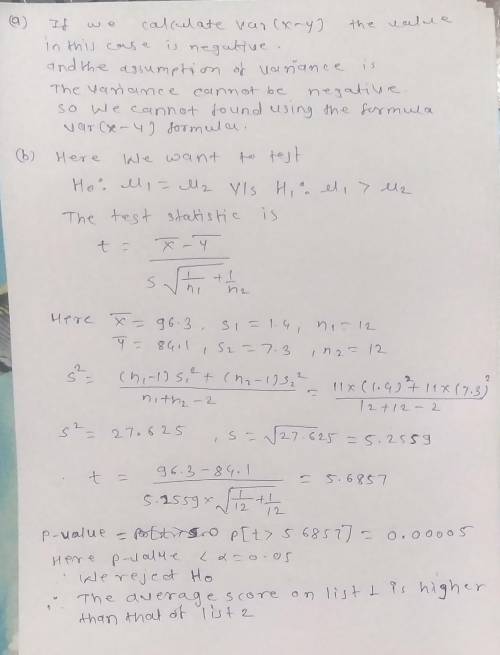
You decide to test if the Stroop effect is present in non-colorblind college students, so you recruit a dozen random students at various colleges and have each person read both List 1 and 2 (you randomize who gets which one first) recording how many answers were correct. You get the below sumamrized results:
List 1 - List 2
Mean: List 1: 96.3, List 2: 84.1, List 1 - List 2: 12.2
SD: List 1: 1.4, List 2: 7.3, List 1 - List 2: ?
n: List 1: 12, List 2: 12, List 1 - List 2: 12
a. Explain why the ? cannot be found using the Var(X-Y) formula
b. You wish to conduct a HT exploring if the average score on List 1 is higher than that of List 2. What value should ? be if you want a P-value of 0.02?

Answers: 2


Another question on Mathematics
Mathematics, 21.06.2019 19:00
What is the percentile for data value 6 in the following data set? 4 13 8 6 4 4 13 6 4 13 2 13 15 5 9 4 12 8 6 13 40 25 35 62
Answers: 2
Mathematics, 21.06.2019 21:30
Consider the following equation. 1/2x^3+x-7=-3sqrtx-1 approximate the solution to the equation using three iterations of successive approximation. use the graph below as a starting point. a. b. c. d.
Answers: 3
Mathematics, 21.06.2019 22:00
Here is my question! jayne is studying urban planning and finds that her town is decreasing in population by 3% each year. the population of her town is changing by a constant rate.true or false?
Answers: 2
Mathematics, 22.06.2019 02:30
Researchers are conducting experiments to determine the role of alcohol in the development of depression. after the study is complete, they determine that the relative risk of developing depression is 1.55 with a 95 % ci of 1.2 -1.9. each group is then divided into nonsmokers and smokers. the relative risk for the nonsmokers is 1.12 with a 95% ci of 0.87-1.37. the relative risk for the smokers is 1.7 with a 95 % cl of 1.5-1.9. what type of bias may affect this study? a. procedure bias b. recall bias c. selection bias d. confounding e. lead-time bias
Answers: 2
You know the right answer?
Do humans have free will or are we hamstrung by greater forces (or even ourselves!)? Let's find out....
Questions

History, 14.01.2021 17:00


English, 14.01.2021 17:00

Computers and Technology, 14.01.2021 17:00

Computers and Technology, 14.01.2021 17:00

Computers and Technology, 14.01.2021 17:00
Social Studies, 14.01.2021 17:00
Computers and Technology, 14.01.2021 17:00


