
Mathematics, 21.01.2020 19:31 jamayeah02
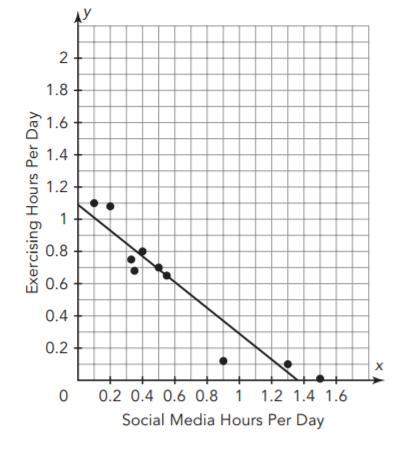
The graph shows the number of hours per day spent on social media by a group of teenagers and the number of hours per day spent exercising. a line of best fit for the data is shown.
use the graph to determine how many hours a teenager would spend exercising in one day if they spent 0.25 hours on social media.
use the graph to determine how many hours a teenager would spend exercising in one day if they spent 1.38 hours on social media.
do you think the predictions from part (a) and part (b) are reliable? explain your reasoning.

Answers: 3


Another question on Mathematics
Mathematics, 21.06.2019 17:30
At a sale this week, a desk is being sold for $213. this is a 29% discount from the original price. what is the original price?
Answers: 1
Mathematics, 21.06.2019 18:50
Which of the following is a function? a.) {(-2, -4/5), (-1,-,,-1)} b.) {(-2,,1/,3/,1)} c.) {(-22)} d.) {(-21)}
Answers: 3
Mathematics, 21.06.2019 19:00
Human body temperatures have a mean of 98.20° f and a standard deviation of 0.62°. sally's temperature can be described by z = 1.4. what is her temperature? round your answer to the nearest hundredth. 99.07°f 97.33°f 99.60°f 100.45°f
Answers: 1
Mathematics, 21.06.2019 19:30
We just started the introduction into circles and i have no idea how to do this.
Answers: 3
You know the right answer?
The graph shows the number of hours per day spent on social media by a group of teenagers and the nu...
Questions
Mathematics, 13.07.2019 15:30

English, 13.07.2019 15:30
Mathematics, 13.07.2019 15:30
Mathematics, 13.07.2019 15:30
Mathematics, 13.07.2019 15:30

History, 13.07.2019 15:30
Mathematics, 13.07.2019 15:30
History, 13.07.2019 15:30

Biology, 13.07.2019 15:30
Mathematics, 13.07.2019 15:30
Mathematics, 13.07.2019 15:30


