
Mathematics, 02.12.2019 20:31 oscaryn7213
The graph below shows the distance, y, in miles, of a bird from its nest for a certain amount of time, x, in minutes:
graph titled distance vs time is shown with time in minutes along the x-axis and distance from nest in miles along the y-axis. the scale on the x-axis shows the numbers 0 to 25 at increments of 5, and the scale on the y-axis shows the numbers 1 to 8 at increments of 1. a straight line joins the ordered pairs 0, 3 and 5, 4 and 10, 5 and 15, 6 and 20, 7.
based on the graph, what is the initial value of the graph and what does it represent?
3 miles per minute; it represents the speed of the bird
0.2 mile per minute; it represents the speed of the bird
0.2 mile; it represents the original distance of the bird from its nest
3 miles; it represents the original distance of the bird from its nest

Answers: 3
 miles per minute represents the speed of the bird and 3 miles represents the original distance of the bird from its nest.
 and
and 
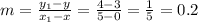

 , y-axis is the distance so in
  minutes the the distance covered by the bird must be equal to to y-axis value which is
  miles.
 the bird has started from y-intercept value
  so we can say that,the original distance of the bird from its nest is
  .
. and
and 
 per minute and is

Another question on Mathematics
Mathematics, 21.06.2019 14:40
How many square feet of out door carpet will we need for this hole? 8ft 3ft 12ft 4ft
Answers: 1
Mathematics, 21.06.2019 18:00
Louise measured the perimeter of her rectangular scrapbook to be 154 cm. if the scrapbook is 45 cm wide, how long is the scrapbook?
Answers: 1
Mathematics, 22.06.2019 02:30
What is the difference between –12 and –5? what is the distance between –12 and –7 on a number line? units
Answers: 1
You know the right answer?
The graph below shows the distance, y, in miles, of a bird from its nest for a certain amount of tim...
Questions

Social Studies, 25.11.2021 14:10


Business, 25.11.2021 14:10

English, 25.11.2021 14:10

Computers and Technology, 25.11.2021 14:10
Mathematics, 25.11.2021 14:10
SAT, 25.11.2021 14:10
Mathematics, 25.11.2021 14:10

Biology, 25.11.2021 14:10


Medicine, 25.11.2021 14:10


