
Mathematics, 22.11.2019 11:31 brendacauani12345
You have a statistics project due in your math class. as part of the project for one hour you count how many shoppers at your favorite store are between the ages of 21 and 25. your frequency table is below. use this table to answer questions (a-c)
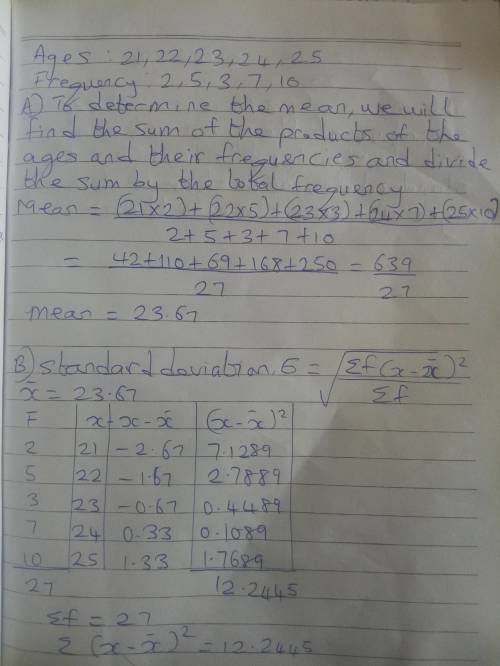
ages: 21,22,23,24,25
frequency: 2,5,3,7,10
a) find the mean of the data
b) find the standard deviation of the data
c) explain what the mean and standard deviation tell you about the data you collected

Answers: 2


Another question on Mathematics
Mathematics, 21.06.2019 17:30
What number should be added to the expression x^2+3x+ in order to create a perfect square trinomial? 3/2 3 9/4 9
Answers: 1
Mathematics, 21.06.2019 19:30
Ascientist wants to use a model to present the results of his detailed scientific investigation. why would a model be useful? a )because the model makes the concepts easier to understand b) because the model is easy to put together and to use c) because the model prevents other scientists from asking questions d) because the model requires the audience to pay full attention to it i don't know what to choose because between a and d a is much more likely than d because it only wants to get the attention of the audience. i'm confuse.
Answers: 1
Mathematics, 21.06.2019 22:30
What is the approximate value of q in the equation below? –1.613–1.5220.5853.079
Answers: 1
Mathematics, 22.06.2019 03:30
Ling is using fraction strips to add 2/3 and 7/12's the sum is one whole plus how many twelves?
Answers: 1
You know the right answer?
You have a statistics project due in your math class. as part of the project for one hour you count...
Questions

History, 17.07.2020 16:01
History, 17.07.2020 16:01


Social Studies, 17.07.2020 16:01
Mathematics, 17.07.2020 16:01


Computers and Technology, 17.07.2020 16:01


