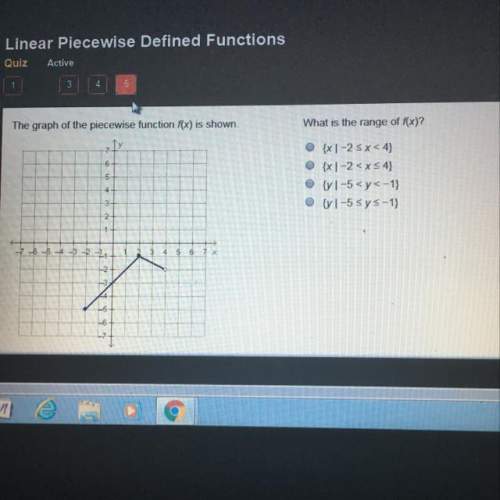
Mathemaus
6. which box plot has the largest interquartile range?
0
4
8
12<...

Mathematics, 02.10.2019 06:10 shanua
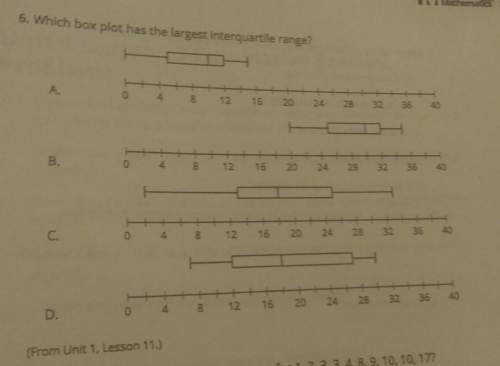
Mathemaus
6. which box plot has the largest interquartile range?
0
4
8
12
16
20 24 28 32 36
40
b.
0
4
8
12
16
20
24
28
32
36
40
10
4
8
12
16
32
36
40
20 24 28
32
36
40
4
12
o
16 20 24 28

Answers: 1


Another question on Mathematics
Mathematics, 21.06.2019 14:30
Select true or false to tell whether the following conditional p q is true or false. use the truth table if needed. if a week has seven days, then a year has twenty months.
Answers: 1
Mathematics, 21.06.2019 16:10
Determine whether the following statements are true and give an explanation or counterexample. bold a. when using the shell method, the axis of the cylindrical shells is parallel to the axis of revolution. bold b. if a region is revolved about the y-axis, then the shell method must be used. bold c. if a region is revolved about the x-axis, then in principle it is possible to use the disk/washer method and integrate with respect to x or the shell method and integrate with respect to y.
Answers: 3
Mathematics, 21.06.2019 16:30
Pete is making decorations for a dinner party. the instructions tell him to use 9 flowers for a medium-sized decoration. complete each statement to adjust the flowers for different-sized decorations based on these instructions.
Answers: 3
Mathematics, 21.06.2019 17:00
The table shows population statistics for the ages of best actor and best supporting actor winners at an awards ceremony. the distributions of the ages are approximately bell-shaped. compare the z-scores for the actors in the following situation. best actor best supporting actor muequals42.0 muequals49.0 sigmaequals7.3 sigmaequals15 in a particular year, the best actor was 59 years old and the best supporting actor was 45 years old. determine the z-scores for each. best actor: z equals best supporting actor: z equals (round to two decimal places as needed.) interpret the z-scores. the best actor was (more than 2 standard deviations above more than 1 standard deviation above less than 1 standard deviation above less than 2 standard deviations below) the mean, which (is not, is) unusual. the best supporting actor was (less than 1 standard deviation below more than 1 standard deviation above more than 2 standard deviations below more than 1 standard deviation below) the mean, which (is is not) unusual.
Answers: 1
You know the right answer?
Questions
Mathematics, 22.10.2020 20:01

Social Studies, 22.10.2020 20:01

Mathematics, 22.10.2020 20:01


History, 22.10.2020 20:01
Mathematics, 22.10.2020 20:01
Mathematics, 22.10.2020 20:01
English, 22.10.2020 20:01
History, 22.10.2020 20:01
History, 22.10.2020 20:01

Health, 22.10.2020 20:01


