Which description best fits the distribution of the data
shown in the histogram?
...

Mathematics, 28.12.2019 14:31 livingfamyboys35
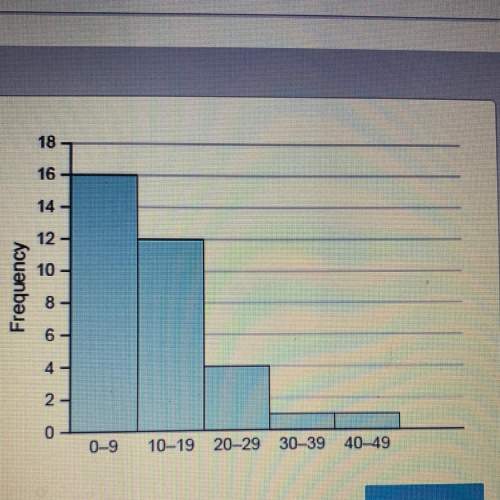
Which description best fits the distribution of the data
shown in the histogram?
a. the mean is greater than the median.
b. the mean and median are approximately the same
c. the mean is less than the median

Answers: 1


Another question on Mathematics
Mathematics, 21.06.2019 21:30
Helll ! 1,400 tons of wheat of two different varieties was delivered to the silo. when processing one variety, there was 2% of waste and 3% during the processing of the second variety of wheat. after the processing, the amount of remaining wheat was 1,364 tons. how many tons of each variety of wheat was delivered to the silo?
Answers: 1
Mathematics, 21.06.2019 23:00
Delbert keeps track of total of the total number of points he earns on homework assignments, each of which is worth 60 points. at the end of the semester he has 810 points. write an equation for delbert’s average homework score a in terms of the number of assignments n.
Answers: 3
Mathematics, 21.06.2019 23:30
Which of the following vectors are orthogonal to (2,1)? check all that apply
Answers: 1
You know the right answer?
Questions

History, 22.11.2021 14:00
Mathematics, 22.11.2021 14:00

Computers and Technology, 22.11.2021 14:00


English, 22.11.2021 14:00
Mathematics, 22.11.2021 14:00

Mathematics, 22.11.2021 14:00
English, 22.11.2021 14:00


