
Chemistry, 22.04.2021 20:40 CHEVYWADDELL
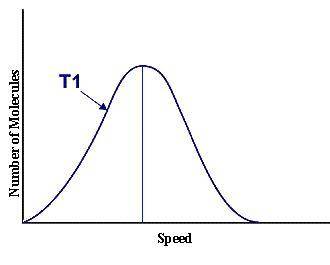
This graph represents a population of molecules in a gas versus the distribution of the average velocity(speed) of its molecules in that population. Assume all molecules to be of the same mass. In reading the graph, it is important to note three things. One, is the most probable speed is at the peak of the curve. Secondly, the most probable speed increases as the temperature increases (so shift to the right), and the distribution broadens as it increases.
On the graph, indicate the average kinetic energy of the population.
Explain your answer.
What part of the graph indicates the temperature of the sample?
Explain your answer.

Answers: 3


Another question on Chemistry
Chemistry, 21.06.2019 19:00
Y=‐1x + 7 if y has a value of ‐24 what is the value of x?
Answers: 1
Chemistry, 22.06.2019 03:00
What happened in 2012 and how does it illustrate the importance of understanding the sun and how it works?
Answers: 3
Chemistry, 22.06.2019 03:30
Melting and boiling are endothermic processes. this means that these processes absorb energy from their surroundings in order to occur. use this information and the data you collected in the phase change gizmo to describe what happens to the temperature of water when you boil it, then explain why this result occurs.
Answers: 2
Chemistry, 22.06.2019 03:30
At a temperature of 393 k, the temperature of a sample of nitrogen is 1.07 atm what will the pressure be at a temperature of 478 k
Answers: 1
You know the right answer?
This graph represents a population of molecules in a gas versus the distribution of the average velo...
Questions

Mathematics, 15.03.2022 17:40

Medicine, 15.03.2022 17:40

History, 15.03.2022 17:40

English, 15.03.2022 17:40
Mathematics, 15.03.2022 17:50
Chemistry, 15.03.2022 17:50

Physics, 15.03.2022 17:50

Biology, 15.03.2022 17:50

Social Studies, 15.03.2022 17:50
Physics, 15.03.2022 17:50
Mathematics, 15.03.2022 17:50
Biology, 15.03.2022 17:50
Mathematics, 15.03.2022 17:50


