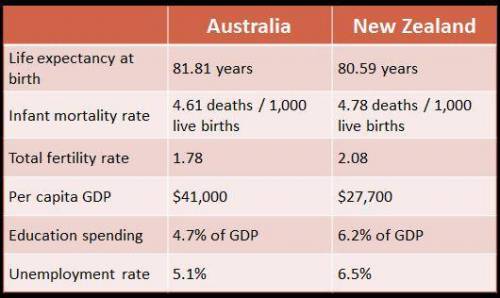
Analyze the chart below and answer the question that follows.
A 3-column table with 6 ro...

Social Studies, 06.05.2020 03:18 kindaconfuseing
Analyze the chart below and answer the question that follows.
A 3-column table with 6 rows. Column 1 has entries Life expectancy at birth, Infant mortality rate, Total fertility rate, Per capita G D P, Education spending, Unemployment rate. Column 2 is labeled Australia with entries 81.81 years, 4.61 deaths per 1,000 live births, 1.78, 41,000 dollars, 4.7 percent of G D P, 5.1 percent. Column 3 is labeled New Zealand with entries 80.59 years, 4.78 deaths per 1,000 live births, 2.08, 27,700 dollars, 6.2 percent of G D P, 6.5 percent.
Data courtesy of the CIA World Factbook
Which of the indicators on the chart above tell(s) us that Australia and New Zealand are highly developed countries?
A.
per capita GDP
B.
unemployment rate
C.
infant mortality rate
D.
all of the above
Please select the best answer from the choices provided
A
B
C
D

Answers: 1


Another question on Social Studies
Social Studies, 22.06.2019 03:00
Which situation is an example of a citizen participating in a politicial process
Answers: 1
Social Studies, 22.06.2019 10:00
Which conflict is often referred to as the first "televised war"? a) gulf war b) korean war c) vietnam war d) world war ii
Answers: 2
Social Studies, 23.06.2019 01:00
The state fire marshal ensures a program can legally operate in a specific location and has sound structure?
Answers: 3
You know the right answer?
Questions

Mathematics, 04.07.2019 20:30

English, 04.07.2019 20:30

History, 04.07.2019 20:30
English, 04.07.2019 20:30

English, 04.07.2019 20:30
Mathematics, 04.07.2019 20:30
Mathematics, 04.07.2019 20:30


