
Social Studies, 25.04.2020 03:22 sugar1014
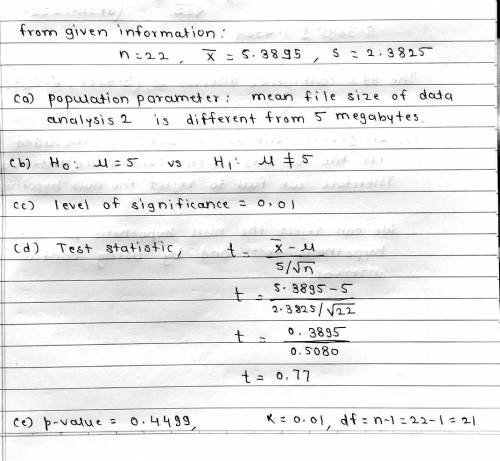
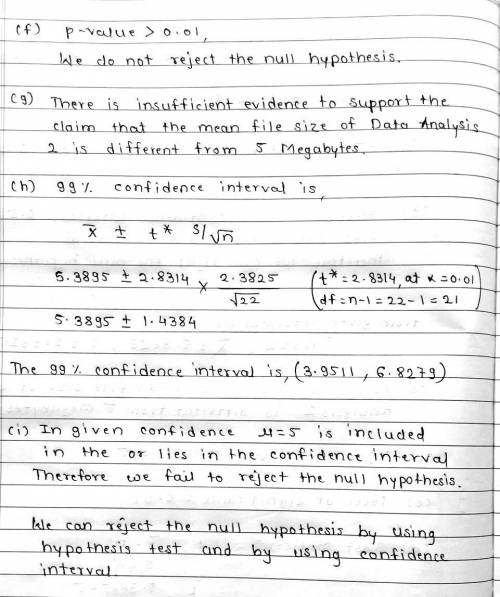
A random sample of 22 STAT 250 students was collected and the file size of Data Analysis 2 was recorded. The data was measured in megabytes. The instructors of the course claim that the file size will be different from 5 megabytes. Consider the population of all file sizes to be right skewed. Using = 0.01, is there sufficient evidence to conclude that the mean file size of Data Analysis 2 is different from 5 megabytes? Conduct a full hypothesis test by following the steps below. Enter an answer for each of these steps in your document. a) Define the population parameter in one sentence. b) State the null and alternative hypotheses using correct notation. c) State the significance level for this problem. d) Create a histogram and a box plot of the sample data and copy these into your document. e) Use the graphs created in part (d) to check the conditions that allow you to calculate the test statistic in one to two sentences. f) No matter your results in part (d & e), calculate the test statistic "by-hand." Show the work necessary to obtain the value by typing your work and provide the resulting test statistic. Do not round during the calculation. Then, round the test statistic to two decimal places after you complete the calculation. g) Use StatCrunch (Stat T Stats One Sample with Data) to verify your test statistic. Copy and paste this box into your document. h) State the p-value using the output provided in part (g). Use four decimal places for the p-value. In addition, state the degrees of freedom.

Answers: 1


Another question on Social Studies
Social Studies, 22.06.2019 09:30
Which political reform gave people the power to put a proposed law on the ballot? referendum initiative direct primary recall
Answers: 1
Social Studies, 22.06.2019 13:00
Abadger lives in oak grove forest. it is a female and it is four years old. which of the following animals could be considered a member of this badger's population? a. a two-year old male red fox living in oak grove forest b. a ten-year-old female skunk living in pine warden forest c. a four-year-old female badger living in a zoo d. a ten-year-old male badger living in oak grove forest
Answers: 2
Social Studies, 22.06.2019 18:30
Which of the following best summarizes the idea represented by this graph?
Answers: 2
Social Studies, 22.06.2019 21:10
Which of these is the best example of a cause-and-effect chain of events? 1. alonzo went to the music festival. 2. carmen went to the same music festival. 3. alonzo met carmen at the music festival. 1. yosef bought a new car from a dealership. 2. bailey bought a car from the same dealership. 3. bailey paid more for his car than yosef did. 1. the high school football team played a game on friday night. 2. the drama club put on a play on friday night. 3. maya watched the football game instead of the play. 1. a fast food restaurant ran an advertisement on television. 2. hank saw the advertisement and got hungry. 3. hank went to the fast food restaurant and bought food.
Answers: 1
You know the right answer?
A random sample of 22 STAT 250 students was collected and the file size of Data Analysis 2 was recor...
Questions


Arts, 10.04.2020 12:43


History, 10.04.2020 12:43
Arts, 10.04.2020 12:43

Chemistry, 10.04.2020 12:44

Geography, 10.04.2020 12:44
English, 10.04.2020 12:44
English, 10.04.2020 12:44

Mathematics, 10.04.2020 12:44

Physics, 10.04.2020 12:44
English, 10.04.2020 12:44
History, 10.04.2020 12:44
Mathematics, 10.04.2020 12:44
Mathematics, 10.04.2020 12:46
Mathematics, 10.04.2020 12:46
Chemistry, 10.04.2020 12:46


