1, 2, and 3.
Explanation:
Hello.
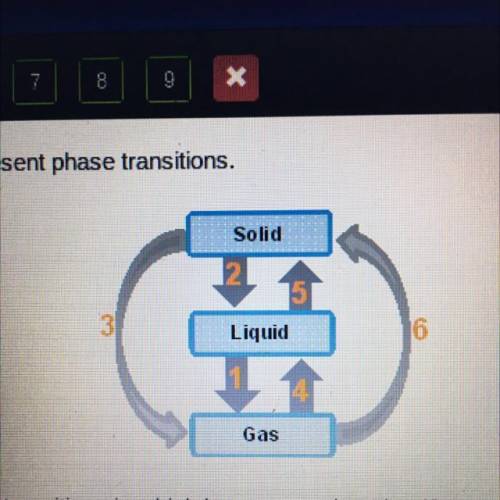
In this process, since the phase transitions that require energy are those that pass from a state with less energy or more molecular order to a state with more energy or less molecular order, say, from solid to liquid (melting), from liquid to gas (boiling) and from solid to gas (sublimation), we can conclude that the arrows representing heat energy gained are 1, 2, and 3 since 1 represents boiling, 2 melting and 3 sublimation.
Best regards.