Physics, 26.02.2020 21:05 christinaS7696
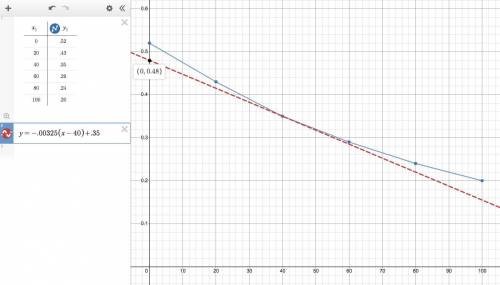
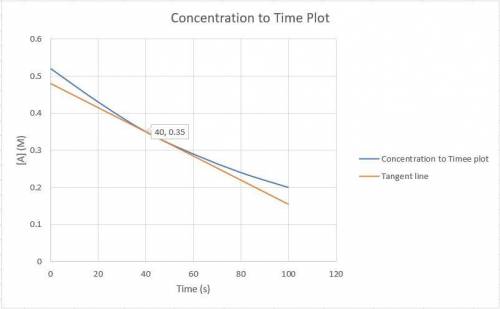
The blue curve is the plot of the data. The straight orange line is tangent to the blue curve at t = 40 s. A plot has the concentration of A in molar on the y axis and time in seconds on the x axis. A curve contains the points (0, 0.52), (20, 0.43), (40, 0.35), (60, 0.29), (80, 0.24), and (100, 0.20). A line touches the curve at (40, 0.35) and has a y intercept of (0, 0.48). Approximate the instantaneous rate of this reaction at time t = 40 s.

Answers: 3


Another question on Physics

Physics, 21.06.2019 17:20
Write maxwell's equations and discuss the terms involved and the results of each equation in classical electrodynamics. if it is possible to write these equations in integral form, give the integral forms. find the wave equation for electromagnetic waves from the maxwell equations. what is the propagation velocity of electromagnetic waves in space according to the wave equation you find?
Answers: 3

Physics, 22.06.2019 05:00
Which is the best predictor of the radioactive nature of an isotope? o the proton-to-electron ratio the neutron-to-proton ratio o the neutron-to-electron ratio the electron-to-proton ratio
Answers: 1

Physics, 22.06.2019 12:00
An architect plans to use solar energy to heat the next house he designs. what principle of absorption and infrared energy can be applied to the design of the new house? how could she apply to those principals?
Answers: 2

Physics, 22.06.2019 12:10
Energy flows from the producer level to the level. is called
Answers: 1
You know the right answer?
The blue curve is the plot of the data. The straight orange line is tangent to the blue curve at t =...
Questions

Business, 29.06.2019 03:10


Advanced Placement (AP), 29.06.2019 03:10


Computers and Technology, 29.06.2019 03:10

Computers and Technology, 29.06.2019 03:10

Computers and Technology, 29.06.2019 03:10

![\begin{array}{|c|cc|}Time \ (s)&&Concentration \ (M)\\0&&0.52\\20&&0.43\\40&&0.35\\60&&0.29\\80&&0.24\\100&&0.20\end{array}\right]](/tpl/images/0525/4652/13e0a.png)


