Question
your assignment: coffee shop prices
choosing a model
you are your boss,...

Mathematics, 20.09.2019 18:50 kalbaugh
Question
your assignment: coffee shop prices
choosing a model
you are your boss, the owner of a coffee shop, set prices. she has gathered some data by counting the number of cups sold per day at various prices. your job is to see if there is a relationship between price and sales for one of the two most popular drinks.
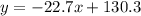
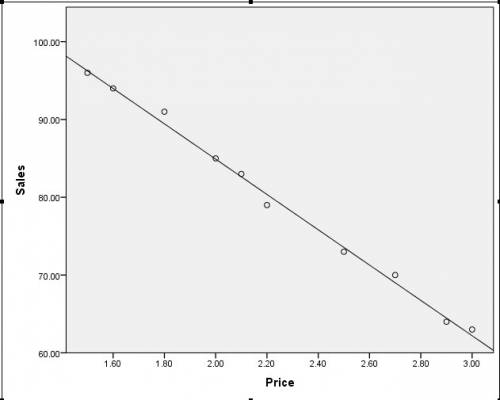
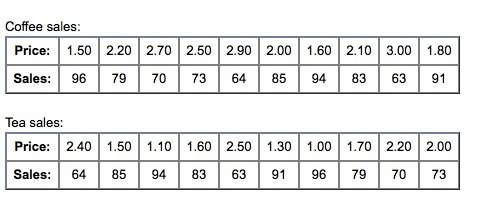
coffee sales:
price: 1.50 2.20 2.70 2.50 2.90 2.00 1.60 2.10 3.00 1.80
sales: 96 79 70 73 64 85 94 83 63 91
tea sales:
price: 2.40 1.50 1.10 1.60 2.50 1.30 1.00 1.70 2.20 2.00
sales: 64 85 94 83 63 91 96 79 70 73
1. which drink did you select? circle one.
coffeetea
find a line of best fit.
2. enter the data into your calculator and perform a linear regression. round a and b to the nearest tenth. (2 points: 1 point for slope and 1 point for y-value of y-intercept)
what is your linear regression equation?
3. what is the meaning of the slope? (2 points)
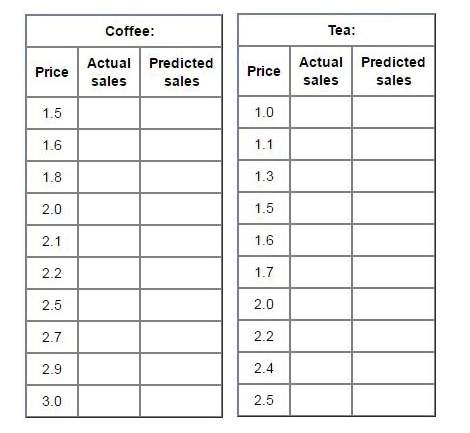
4. create a scatterplot for your beverage using the data from the table. then graph the linear regression equation you found in question 2. (4 points)
5. does the line of best fit seem like a good model for the data? why or why not? (2 points)
6. complete the table. (10 points: 1 point for each row)
identify the actual number of sales at each price.
use your line of best fit to calculate the predicted sales at each price.
prompt
on-screen text:
coffee shop prices
a begin button starts the animation.
[click "begin."]
on-screen text:
you are your boss, the owner of a coffee shop, set prices. she has gathered some data by counting the number of cups sold per day at various prices. your job is to see if there is a relationship between price and sales for one of the two most popular drinks. will you choose coffee or tea?
which will you choose?
[two images of mugs are shown: one filled with coffee and surrounded by coffee beans, and the other filled with tea, with a sprig of mint next to the mug.]
[click "coffee."] great! you will look at coffee sales. use the data in the table to find the line of best fit. then evaluate your model.
[a table with two sets of data is shown.]
price: 1.50, 2.20, 2.70, 2.50, 2.90, 2.00, 1.60, 2.10, 3.00, 1.80
sales: 96, 79, 70, 73, 64, 85, 94, 83, 63, 91
[click "tea."] great! you will look at tea sales. use the data in the table to find the line of best fit. then evaluate your model.
[a table with two sets of data is shown.]
price: 2.40, 1.50, 1.10, 1.60, 2.50, 1.30, 1.00, 1.70, 2.20, 2.00
sales: 64, 85, 94, 83, 63, 91, 96, 79, 70, 73

Answers: 1


Another question on Mathematics
Mathematics, 21.06.2019 13:40
Aparallel system functions whenever at least one of its components works. consider a parallel system of n components, and suppose each component works independently with probability 0.5. find the conditional probability that component n works given that the system is working
Answers: 3
Mathematics, 21.06.2019 23:40
In the diagram, a building cast a 35-ft shadow and a flagpole casts an 8-ft shadow. if the the flagpole is 18 ft tall, how tall is the building? round the the nearest tenth.
Answers: 2
Mathematics, 22.06.2019 01:10
Jobs and productivity! how do retail stores rate? one way to answer this question is to examine annual profits per employee. the following data give annual profits per employee (in units of 1 thousand dollars per employee) for companies in retail sales. assume σ ≈ 4.0 thousand dollars. 3.7 6.7 3.6 8.5 7.5 5.9 8.7 6.4 2.6 2.9 8.1 −1.9 11.9 8.2 6.4 4.7 5.5 4.8 3.0 4.3 −6.0 1.5 2.9 4.8 −1.7 9.4 5.5 5.8 4.7 6.2 15.0 4.1 3.7 5.1 4.2 (a) use a calculator or appropriate computer software to find x for the preceding data. (round your answer to two decimal places.) thousand dollars per employee (b) let us say that the preceding data are representative of the entire sector of retail sales companies. find an 80% confidence interval for μ, the average annual profit per employee for retail sales. (round your answers to two decimal places.) lower limit -- thousand dollars upper limit -- thousand dollars (c) let us say that you are the manager of a retail store with a large number of employees. suppose the annual profits are less than 3 thousand dollars per employee. do you think this might be low compared with other retail stores? explain by referring to the confidence interval you computed in part (b). yes. this confidence interval suggests that the profits per employee are less than those of other retail stores. no. this confidence interval suggests that the profits per employee do not differ from those of other retail stores. correct: your answer is correct. (d) suppose the annual profits are more than 6.5 thousand dollars per employee. as store manager, would you feel somewhat better? explain by referring to the confidence interval you computed in part (b). yes. this confidence interval suggests that the profits per employee are greater than those of other retail stores. no. this confidence interval suggests that the profits per employee do not differ from those of other retail stores. (e) find an 95% confidence interval for μ, the average annual profit per employee for retail sales. (round your answers to two decimal places.) lower limit 3.75 incorrect: your answer is incorrect. thousand dollars upper limit 6.41 incorrect: your answer is incorrect. thousand dollars
Answers: 3
Mathematics, 22.06.2019 02:30
Carlos by 24 mi and ran 6 miles what is the ratio of the distance carlos ran to the distance he biked
Answers: 1
You know the right answer?
Questions
Mathematics, 03.08.2021 19:40

English, 03.08.2021 19:40


Social Studies, 03.08.2021 19:40

Health, 03.08.2021 19:40
Mathematics, 03.08.2021 19:40
Mathematics, 03.08.2021 19:40
Mathematics, 03.08.2021 19:40
Physics, 03.08.2021 19:40

Chemistry, 03.08.2021 19:40


