
Mathematics, 06.10.2019 10:02 juelchasse
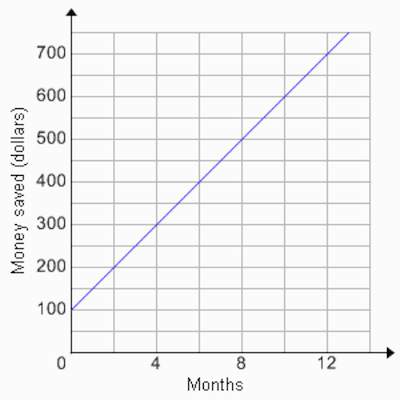
Alex is trying to start a savings plan. the following graph represents his projected savings over the next 12 months. how much money will he have saved by the sixteenth month?
graph with months on the x axis and money saved in dollars on the y axis. graph shows a line hitting points (0, 100), (4, 300), (8, 500), and (12, 700)
$700
$800
$900
$1000

Answers: 1


Another question on Mathematics
Mathematics, 21.06.2019 17:10
Complete the table for different values of x in the polynomial expression -7x2 + 32x + 240. then, determine the optimal price that the taco truck should sell its tacos for. assume whole dollar amounts for the tacos.
Answers: 2
Mathematics, 21.06.2019 18:00
Arecipe calls for 2 2/4 cups of raisins, but julie only has a 1/4 measuring cup. how many 1/4 cups is needed to measure out 2 2/4 cups of raisins?
Answers: 1
Mathematics, 21.06.2019 19:00
To solve the system of equations below, pedro isolated the variable y in the first equation and then substituted it into the second equation. what was the resulting equation? { 5y=10x {x^2+y^2=36
Answers: 1
Mathematics, 22.06.2019 02:20
Which equation can be simplified to find the inverse of y = 2x2^2
Answers: 2
You know the right answer?
Alex is trying to start a savings plan. the following graph represents his projected savings over th...
Questions

Mathematics, 04.12.2020 23:10

Computers and Technology, 04.12.2020 23:10


Computers and Technology, 04.12.2020 23:10
Mathematics, 04.12.2020 23:10

Geography, 04.12.2020 23:10

History, 04.12.2020 23:10
Mathematics, 04.12.2020 23:10


