
Mathematics, 26.07.2019 01:30 bradydodson47
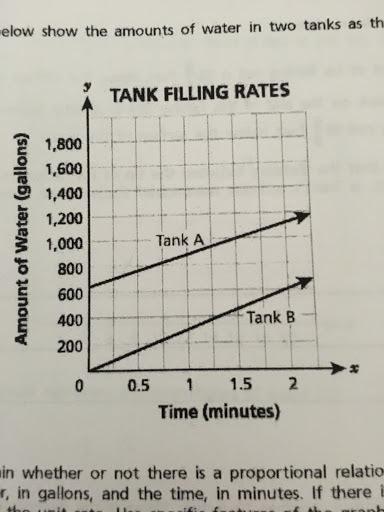
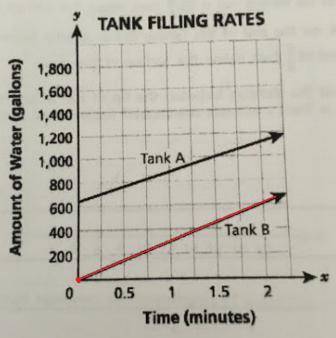
The lines graphed below dhow the amounts of water in two tanks as they were being filled over time. for each tank, explain whether or not there is a proportional relationship between the amount of water, in gallons, and the time in minutes. if there is a proportional relationship, identify the unit rate. use specific features of the graph to support your answer.

Answers: 1


Another question on Mathematics
Mathematics, 21.06.2019 14:00
F(x) = (x^2 + 3x − 4) and g (x) = (x+4) find f/g and state the domain.
Answers: 1
Mathematics, 21.06.2019 20:00
Which type of graph would allow us to compare the median number of teeth for mammals and reptiles easily
Answers: 2
Mathematics, 21.06.2019 22:30
If a line is defined by the equation y = 5x + 2, what is the slope?
Answers: 2
Mathematics, 22.06.2019 03:10
Suppose that a customer is purchasing a car. he conducts an experiment in which he puts 10 gallons of gas in the car and drives it until it runs out of gas. he conducts this experiment 15 times on each car and records the number of miles driven. full data set car 1 238238 216216 205205 212212 240240 274274 297297 252252 260260 247247 257257 243243 296296 243243 290290 car 2 245245 204204 215215 209209 251251 165165 221221 295295 172172 287287 268268 305305 320320 260260 297297 describe each data set, that is determine the shape, center, and spread. sample mean for car 1 x overbar equalsx=216216 mi / 10 gal (type an integer or decimal rounded to one decimal place as needed.) sample mean for car 2 x overbar equalsx=209209 mi / 10 gal (type an integer or decimal rounded to one decimal place as needed.)
Answers: 1
You know the right answer?
The lines graphed below dhow the amounts of water in two tanks as they were being filled over time....
Questions

Mathematics, 02.07.2020 06:01


Computers and Technology, 02.07.2020 06:01
Computers and Technology, 02.07.2020 06:01

Mathematics, 02.07.2020 06:01

Mathematics, 02.07.2020 06:01
Mathematics, 02.07.2020 06:01


