20 !
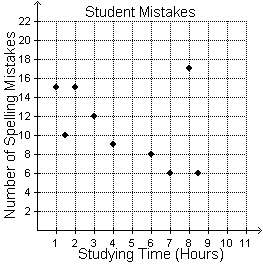
the scatterplot shows the time that some students spent studying and the number of spell...

Mathematics, 30.01.2020 10:02 ValeriaVironche953
20 !
the scatterplot shows the time that some students spent studying and the number of spelling mistakes on an essay test.
which statement about the scatterplot is true?
a..the point (8, 17) can cause the description of the data set to be overstated.
b..although (8, 17) is an extreme value, it should be part of the description of the relationship between studying time and the number of spelling mistakes.
the point (8, 17) can cause the description of the data set to be understated.
d..the point (8, 17) shows that there is no relationship between the studying time and the number of spelling mistakes.

Answers: 2


Another question on Mathematics
Mathematics, 22.06.2019 03:30
Assume that adults have iq scores that are normally distributed with a mean of mu equals 100 and a standard deviation sigma equals 20. find the probability that a randomly selected adult has an iq less than 132. the probability that a randomly selected adult has an iq less than 132 is?
Answers: 1
Mathematics, 22.06.2019 03:30
Graph the linear equation find three points on the graph -x+2y=11
Answers: 2
You know the right answer?
Questions


Social Studies, 03.04.2020 20:30


Spanish, 03.04.2020 20:31


