
Mathematics, 27.07.2019 08:30 IntellTanito
Meg plotted the graph below to show the relationship between the temperature of her city and the number of sweaters sold at a store: main title on the graph is sweater sale. graph shows 0 to 30 on x axis at increments of 5 and 0 to 12 on y axis at increments of 1. the label on the x axis is temperature in degree c, and the label on the y axis is number of sweaters sold. dots are made at the ordered pairs 0, 12 and 2.5, 10 and 2.5, 11 and 5, 10 and 7.5, 9 and 7.5, 10 and 10, 7 and 12.5, 6 and 12.5, 8 and 15, 4 and 15, 7 and 17.5, 5 and 20, 1 and 20, 3 and 22.5, 9 and 25, 1 and 27.5, 1. part a: in your own words, describe the relationship between the temperature of the city and the sale of sweaters in the city. part b: describe how you can make the line of best fit. write the approximate slope and y-intercept of the line of best fit. show your work, including the points that you use to calculate slope and y-intercept.

Answers: 1

 , Y- intercept = 16
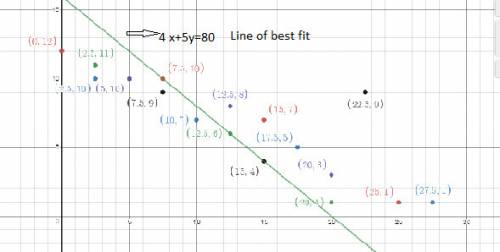


Another question on Mathematics
Mathematics, 21.06.2019 17:30
Write an expression that has three terms and simplifies to 4x - 7. identify the coefficient(s) and constant(s) in your expression
Answers: 1
Mathematics, 21.06.2019 18:30
The distance between two cities is 368 miles. if the scale on the map is 1/4 inch=23 miles, what is the distance between the cities on the map?
Answers: 3
Mathematics, 22.06.2019 00:00
Cody ran nine miles on his first day of training. the next day he ran 1/8 that distance. how far did he run the second day?
Answers: 2
You know the right answer?
Meg plotted the graph below to show the relationship between the temperature of her city and the num...
Questions

Biology, 26.10.2020 19:40


Mathematics, 26.10.2020 19:40

Arts, 26.10.2020 19:40
Spanish, 26.10.2020 19:40
Chemistry, 26.10.2020 19:40
Mathematics, 26.10.2020 19:40


Social Studies, 26.10.2020 19:40


Advanced Placement (AP), 26.10.2020 19:40


