
Mathematics, 20.01.2020 01:31 tay8568
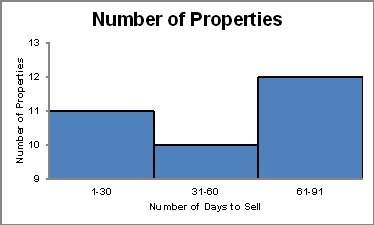
The histogram below shows the number of properties in a town that sold within certain time periods.
why might the graph be considered misleading?
the scales on the x- and y-axes are unequal.
the interval on the x-axis is too large for the data set.
the scale on the y-axis misrepresents the difference in the heights of the bars.
the interval on the y-axis is too large for the data set.

Answers: 3


Another question on Mathematics
Mathematics, 20.06.2019 18:04
Aquadratic function f(x) has a turning point at (3,-7). what is the turning point of -f(x)?
Answers: 1
Mathematics, 21.06.2019 18:40
Acircle has a circumference of 28.36 units what is the diameter of the circle
Answers: 2
Mathematics, 21.06.2019 19:30
Which of the following is the explicit rule for a geometric sequence defined a recursive formula of a -5a for which the first term is 23?
Answers: 1
Mathematics, 21.06.2019 21:00
Meghan has created a diagram of her city with her house, school, store, and gym identified. a. how far is it from the gym to the store? b. meghan also wants to walk to get some exercise, rather than going to the gym. she decides to walk along arc ab. how far will she walk? round to 3 decimal places.
Answers: 2
You know the right answer?
The histogram below shows the number of properties in a town that sold within certain time periods....
Questions


Business, 16.09.2019 01:30

History, 16.09.2019 01:30

English, 16.09.2019 01:30

Social Studies, 16.09.2019 01:30

Physics, 16.09.2019 01:30
Mathematics, 16.09.2019 01:30

Biology, 16.09.2019 01:30


