
Mathematics, 01.08.2019 07:30 youngsavage10120
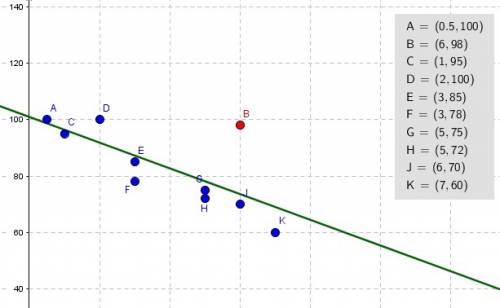
The scatter plot shows the relationship between the test scores of a group of students and the number of hours they spend on social media in a week: a scatter plot is shown. the x-axis is labeled hours spent on social media, and the y-axis is labeled test score. data points are located at 0.5 and 100, 2 and 100, 1 and 95, 3 and 85, 3 and 78, 5 and 75, 5 and 72, 6 and 70, 6 and 98, 7 and 60. a circle labeled a includes all of the points except for the one at 6 and 98. point 6 and 98 is labled b. part a: what is the group of points labeled a called? what is the point labeled b called? give a possible reason for the presence of point b. (3 points) part b: describe the association between a student’s test scores and the number of hours spent on social media. (2 points)

Answers: 1


Another question on Mathematics
Mathematics, 21.06.2019 17:30
How do i make someone brainliest? (if you answer me, i might be able to make you brainliest! )
Answers: 1
Mathematics, 21.06.2019 18:30
Two cyclists 84 miles apart start riding toward each other at the same. one cycles 2 times as fast as the other. if they meet 4 hours later, what is the speed (in mi/h) of the faster cyclist?
Answers: 1
Mathematics, 21.06.2019 19:00
Asap its important using the information in the customer order, determine the length and width of the garden. enter the dimensions.length: feetwidth: feet
Answers: 3
You know the right answer?
The scatter plot shows the relationship between the test scores of a group of students and the numbe...
Questions


Computers and Technology, 23.12.2019 23:31


