
Mathematics, 03.10.2019 03:00 rk193140
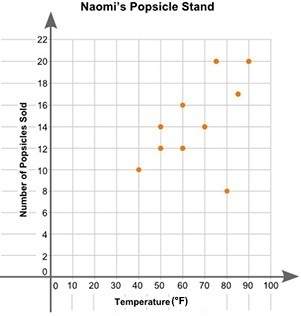
Naomi plotted the graph below to show the relationship between the temperature of her city and the number of popsicles she sold daily:
part a: in your own words, describe the relationship between the temperature of the city and the number of popsicles sold. (2 points)
part b: describe how you can make the line of best fit. write the approximate slope and y-intercept of the line of best fit. show your work, including the points that you use to calculate the slope and y-intercept. (3 points)

Answers: 1


Another question on Mathematics
Mathematics, 21.06.2019 18:00
Ateacher noticed 5/8 of the students were wearing either blue shorts or white shorts. write two different ways this could be done.
Answers: 2
Mathematics, 21.06.2019 19:00
Lena reflected this figure across the x-axis. she writes the vertices of the image as a'(−2, 8), b'(−5, 6), c'(−8, 8), d'(−4, 2).
Answers: 2
Mathematics, 21.06.2019 19:40
The krasnapolski is a top-of-the-line hotel in amsterdam, the netherlands. among their many services, they rent bicycles to guests. the bicycle checkout is open 24 hours per day 7 days per week and has 50 bicycles on hand. on average, 10 guests request a bicycle each day, arriving completely randomly at all times of the day during the spring and summer seasons. guests keep bicycles for four days on average, with a standard deviation of two days. how long does a guest on average have to wait for a bike? a. approximately 24 hours b. approximately 0.033 hours c. approximately 4 days d. approximately 47 minutes
Answers: 3
You know the right answer?
Naomi plotted the graph below to show the relationship between the temperature of her city and the n...
Questions


Health, 24.04.2020 20:23
Mathematics, 24.04.2020 20:23
Mathematics, 24.04.2020 20:23
Mathematics, 24.04.2020 20:23
Mathematics, 24.04.2020 20:23


