
Mathematics, 22.11.2019 03:31 reemoe
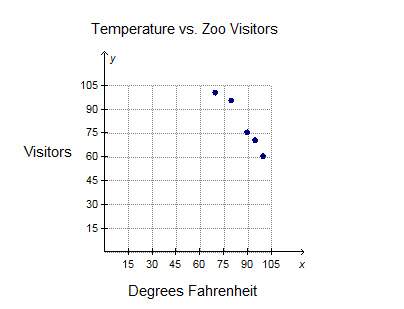
Elijah created the scatterplot to show the relationship between the temperature in degrees fahrenheit and the number of visitors to a zoo.
(graph below)
which is true regarding the data in his scatterplot?
a. as the temperature increases, the number of visitors decreases.
b. as the temperature increases, the number of visitors increases.
c. as the temperature increases, the number of visitors remains the same.
d. as the temperature increases, the number of visitors increases then decreases.

Answers: 3


Another question on Mathematics
Mathematics, 21.06.2019 18:00
If you had $1,900,000, how many days would it take you to spend all if you spent $1 a second. (there are 86,400 seconds in a day)
Answers: 1
Mathematics, 21.06.2019 18:40
Dexter read 11 science fiction books and 5 history books. lena read 9 science fiction books and 4 history books. compare the students’ ratios of science fiction books to history books. 1. determine the ratios’ form: science fiction books to history books 2. write the ratios as fractions: dexter: 115; lena: 94 3. rewrite with a common denominator. 4. compare. 5. answer the question. determine which shows the correct comparison of the ratios for this problem.
Answers: 1
Mathematics, 21.06.2019 19:00
How is working backward similar to solving an equation?
Answers: 1
You know the right answer?
Elijah created the scatterplot to show the relationship between the temperature in degrees fahrenhei...
Questions

Mathematics, 03.10.2021 14:00

Physics, 03.10.2021 14:00
Social Studies, 03.10.2021 14:00
Mathematics, 03.10.2021 14:00
Mathematics, 03.10.2021 14:00
Mathematics, 03.10.2021 14:00
Mathematics, 03.10.2021 14:00


Mathematics, 03.10.2021 14:00
Social Studies, 03.10.2021 14:00
Social Studies, 03.10.2021 14:00
Geography, 03.10.2021 14:00


