
Mathematics, 14.11.2019 06:31 Destinationz
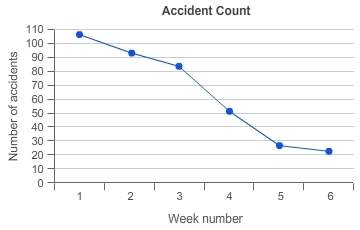
The graph shows the total number of accidents a company had during its 6-week program on safety in the workplace.
what is the best estimate for the difference in the number of accidents from week 3 to week 4?
a) about 35 fewer
b) about 75 fewer
c) about 35 more
d) about 75 more

Answers: 2


Another question on Mathematics
Mathematics, 21.06.2019 21:30
The length of a field is 100 yards and its width is 75 yards. if 1 inch represents 25 yards, what would be the dimensions of the field drawn on a sheet of paper?
Answers: 1
Mathematics, 21.06.2019 22:30
What fraction is equivalent to 0.46464646··· a. 46⁄99 b. 46⁄999 c. 46⁄100 d. 23⁄50
Answers: 1
You know the right answer?
The graph shows the total number of accidents a company had during its 6-week program on safety in t...
Questions

Social Studies, 07.10.2021 14:00
Mathematics, 07.10.2021 14:00

History, 07.10.2021 14:00

Computers and Technology, 07.10.2021 14:00
Social Studies, 07.10.2021 14:00


English, 07.10.2021 14:00

Chemistry, 07.10.2021 14:00
Chemistry, 07.10.2021 14:00
Mathematics, 07.10.2021 14:00
English, 07.10.2021 14:00
Mathematics, 07.10.2021 14:00


