
Mathematics, 17.09.2019 22:30 miajay14
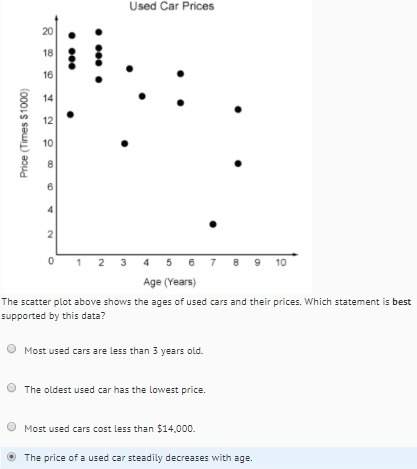
The scatter plot above shows the ages of used cars and their prices. which statement is best supported by this data?
a. most used cars are less than 3 years old.
b. the oldest used car has the lowest price.
c. most used cars cost less than $14,000.
d. the price of a used car steadily decreases with age.

Answers: 1


Another question on Mathematics
Mathematics, 22.06.2019 02:00
1. the manager of collins import autos believes the number of cars sold in a day (q) depends on two factors: (1) the number of hours the dealership is open (h) and (2) the number of salespersons working that day (s). after collecting data for two months (53 days), the manager estimates the following log-linear model: q 4 equation 1 a. explain, how to transform the log-linear model into linear form that can be estimated using multiple regression analysis. the computer output for the multiple regression analysis is shown below: q4 table b. how do you interpret coefficients b and c? if the dealership increases the number of salespersons by 20%, what will be the percentage increase in daily sales? c. test the overall model for statistical significance at the 5% significance level. d. what percent of the total variation in daily auto sales is explained by this equation? what could you suggest to increase this percentage? e. test the intercept for statistical significance at the 5% level of significance. if h and s both equal 0, are sales expected to be 0? explain why or why not? f. test the estimated coefficient b for statistical significance. if the dealership decreases its hours of operation by 10%, what is the expected impact on daily sales?
Answers: 2
Mathematics, 22.06.2019 03:00
A. find the power of the test, when the null hypothesis assumes a population mean of mu = 450, with a population standard deviation of 156, the sample size is 5 and the true mean is 638.47 with confidence intervals of 95 b. find the power of the test, when the null hypothesis assumes a population mean of mu = 644, with a population standard deviation of 174, the sample size is 3 and the true mean is 744.04 with confidence intervals of 95% c. find the power of the test, when the null hypothesis assumes a population mean of mu = 510, with a population standard deviation of 126, the sample size is 10 and the true mean is 529.44 with confidence intervals of 95
Answers: 2
You know the right answer?
The scatter plot above shows the ages of used cars and their prices. which statement is best support...
Questions

History, 31.08.2019 07:30
Mathematics, 31.08.2019 07:30

Social Studies, 31.08.2019 07:30
Mathematics, 31.08.2019 07:30
Social Studies, 31.08.2019 07:30
Social Studies, 31.08.2019 07:30

History, 31.08.2019 07:30
History, 31.08.2019 07:30

Biology, 31.08.2019 07:30

English, 31.08.2019 07:30


Computers and Technology, 31.08.2019 07:30
Mathematics, 31.08.2019 07:30


