
Mathematics, 29.09.2019 04:30 4300224102
Ilooking for either an explanation or answer. i really dont understand how to do this. any is appreciated
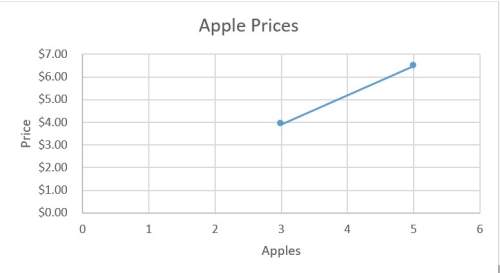
write an equation, in slope-intercept form, that shows the relationship between the number of apples purchased and the total price.
what is the slope of this equation?
describe the relationship between the slope of the line and the rate? what rate is being measured?
what is the y-intercept of this equation?
what does this y-intercept tell you about this equation? what kind of relationship do the two quantities (the number of apples and the amount of money) have?

Answers: 1


Another question on Mathematics
Mathematics, 21.06.2019 21:30
Three friends went on a road trip from phoenix, az, to san diego, ca. mark drove 50 percent of the distance. jason drove 1/8 of the distance. andy drove the remainder of the distance. 1. andy thinks he drove 1/4 of the distance from phoenix, az, to san diego, ca. is andy correct? 2. the distance from phoenix, az, to san diego, ca, is 360 miles. how many miles did each person drive? 3. solve the problem. what is the answer in total?
Answers: 3
Mathematics, 21.06.2019 23:00
Abox holds 500 paperclips. after a week on the teacher's desk 239 paperclips remained. how many paperclips were used?
Answers: 1
Mathematics, 21.06.2019 23:00
Type the correct answer in each box. use numerals instead of words. the average number of subscribers to an online magazine each year from 2010 to 2015 is given in the table below. the average number of subscribers to the online magazine in 2010 was the percent increase in the average number of subscribers in 2011 to the average number of subscribers in 2012 was %. the maximum average number of subscribers to the online magazine in the years shown was
Answers: 2
Mathematics, 22.06.2019 01:30
Have you ever been in the middle of telling a story and had to use hand gestures or even a drawing to make your point? in algebra, if we want to illustrate or visualize a key feature of a function, sometimes we have to write the function in a different form—such as a table, graph, or equation—to determine the specific key feature we’re looking for. think about interactions with others and situations you’ve come across in your own life. how have you had to adjust or change the way you represented something based on either the concept you were trying to describe or the person you were interacting with? explain how the complexity or layout of the concept required you to change your style or presentation, or how the person’s unique learning style affected the way you presented the information.
Answers: 1
You know the right answer?
Ilooking for either an explanation or answer. i really dont understand how to do this. any is appre...
Questions

Physics, 30.08.2019 00:40

Health, 30.08.2019 00:40

Social Studies, 30.08.2019 00:40

Biology, 30.08.2019 00:40

Mathematics, 30.08.2019 00:40
Physics, 30.08.2019 00:40

Mathematics, 30.08.2019 00:40
Mathematics, 30.08.2019 00:40
English, 30.08.2019 00:40
Health, 30.08.2019 00:40
Mathematics, 30.08.2019 00:40


