
Mathematics, 30.07.2019 08:50 sierravick123owr441
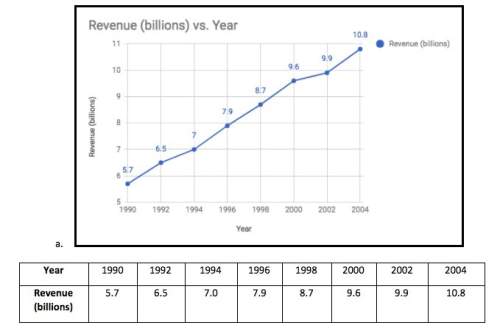
Use the table to make a scatter plot of the data. draw a trend line and write its equation. predict the revenue at us theme parks in 2012. (i already made the graph) 1. suppose you used a line of best fit for a set of data to make a prediction about an unknown value. the correlation coefficient for your data set is –0.025. 2. how confident can you be that your predicted value will be reasonably close to the actual value? how would you know?

Answers: 1


Another question on Mathematics
Mathematics, 21.06.2019 17:30
Lance lived in portugal and brazil for a total of 14 months to learn portuguese. he learned an average of 130 new words per month when he lived in portugal, and an average of 150 new words per month when he lived in brazil. in total he learned 1920 new words. write a system of equations to represent the situation. use x to represent portugal, and y to represent brazil
Answers: 1
Mathematics, 21.06.2019 18:30
Complex numbers multiply √-4 * √-25 and show all intermediate steps. alternative notation is sqrt(-4) * sqrt(-25).
Answers: 1
Mathematics, 21.06.2019 18:30
Ricky takes out a $31,800 student loan to pay his expenses while he is in college. after graduation, he will begin making payments of $190.66 per month for the next 30 years to pay off the loan. how much more will ricky end up paying for the loan than the original value of $31,800? ricky will end up paying $ more than he borrowed to pay off the loan.
Answers: 1
Mathematics, 22.06.2019 00:20
20 ! need ! which exponential function is represented by the table? f(x) = 0.2(0.5x)f(x) = 0.5(5x)f(x) = 0.5(0.2x)f(x) = 0.2(0.2x)
Answers: 1
You know the right answer?
Use the table to make a scatter plot of the data. draw a trend line and write its equation. predict...
Questions

Biology, 05.10.2019 03:10

Physics, 05.10.2019 03:10


Computers and Technology, 05.10.2019 03:10
Computers and Technology, 05.10.2019 03:10
Computers and Technology, 05.10.2019 03:10

Computers and Technology, 05.10.2019 03:20


