
Mathematics, 29.01.2020 20:58 raheeeq
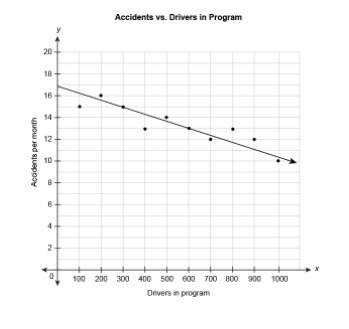
the scatter plot shows the relationship between the number of car accidents in a month and the number of drivers attending a program on distracted driving. the equation represents the linear model for this data.
y=−0.0067x+17
what does the number 17 in the equation mean in this context?
a)there were no accidents per month when there were 17 drivers in the program.
b)the number of accidents decreases by 17 for every 100 drivers in the program.
c)for every 100 drivers in the program, there are 17 accidents per month.
d)there were 17 drivers in the program when it started.
e)there were 17 accidents per month when there were no drivers in the program.

Answers: 2


Another question on Mathematics
Mathematics, 21.06.2019 14:20
If sin θ=24/25 and 0 less than or equal to θ less than or equal to π/2, find the exact value of tan 2θ. answers; a) -527/336 b) -336/527 c)7/24 d) 24/7
Answers: 3
Mathematics, 21.06.2019 23:00
Joey is asked to name a quadrilateral that is also a rhombus and has 2 pairs of parallel sides.should be his answer
Answers: 1
Mathematics, 22.06.2019 02:30
Flvs question 3 exam: 04.10 segment one exam part two what is the measure of angle x? picture is shown
Answers: 1
Mathematics, 22.06.2019 05:00
Three consecutive even numbers have a sum between 84 and 96. a. write an inequality to find the three numbers. let n represent the smallest even number. b. solve the inequality. a. 84 ≤ n + (n + 2) + (n + 4) ≤ 96 b. 78 ≤ n ≤ 90 a. 84 < n + (n + 2) + (n + 4) < 96 b. 26 < n < 30 a. 84 < n + (n + 1) + (n + 2) < 96 b. 27 < n < 31 a. n + (n + 2) + (n + 4) < –84 or n + (n + 2) + (n + 4) > 96 b. n < –30 or n > 31
Answers: 1
You know the right answer?
the scatter plot shows the relationship between the number of car accidents in a month and the numbe...
Questions
Mathematics, 27.12.2020 16:20

Physics, 27.12.2020 16:20
Mathematics, 27.12.2020 16:20


English, 27.12.2020 16:30
English, 27.12.2020 16:30

English, 27.12.2020 16:30

Computers and Technology, 27.12.2020 16:30
English, 27.12.2020 16:30
Mathematics, 27.12.2020 16:30
English, 27.12.2020 16:30


