
Mathematics, 20.03.2022 09:50 heyheyheyhey3
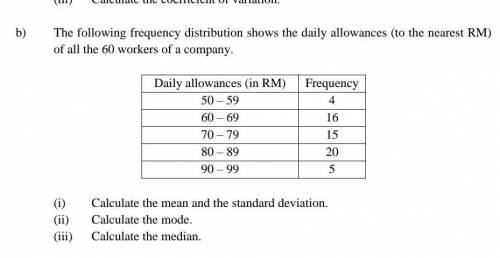
The following frequency distribution shows the daily allowances (to the nearest RM)
of all the 60 workers of a company.
Daily allowances (in RM) Frequency
50 – 59 4
60 – 69 16
70 – 79 15
80 – 89 20
90 – 99 5
(i) Calculate the mean and the standard deviation.
(ii) Calculate the mode.
(iii) Calculate the median.

Answers: 2


Another question on Mathematics
Mathematics, 21.06.2019 20:00
Find the value of x. give reasons to justify your solutions! l, m ∈ kn
Answers: 3
Mathematics, 22.06.2019 00:30
You are riding your bike and notice the square sign above. you mentally draw a straight line from point a to c. describe the angle relationship between dca and bca
Answers: 1
Mathematics, 22.06.2019 02:30
Mr. jones determined that the equation y = 98 - 16/5 x could be used to predict his students' unit test scores, based on the number of days, x, a student was absent during the unit. what was the meaning of the y-intercept of the function? (by the way the 16/5 is a )
Answers: 3
Mathematics, 22.06.2019 04:00
What is the answer to this problem? ignore the work. what is the correct answer?
Answers: 1
You know the right answer?
The following frequency distribution shows the daily allowances (to the nearest RM)
of all the 60...
Questions

Mathematics, 10.05.2021 19:10
English, 10.05.2021 19:10

English, 10.05.2021 19:10
Mathematics, 10.05.2021 19:10

Social Studies, 10.05.2021 19:10

Arts, 10.05.2021 19:10

Biology, 10.05.2021 19:10
English, 10.05.2021 19:10

Chemistry, 10.05.2021 19:10

Spanish, 10.05.2021 19:20
Medicine, 10.05.2021 19:20
Mathematics, 10.05.2021 19:20
Mathematics, 10.05.2021 19:20
Biology, 10.05.2021 19:20
Mathematics, 10.05.2021 19:20


