
Mathematics, 18.03.2022 14:30 Jefferson09
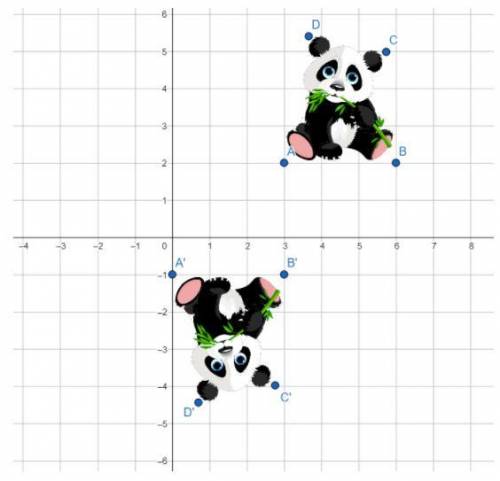
Which two sequential transformations would produce the image of the panda shown in the graph? Reference points have been provided for clarity.
options:
Reflect over the y-axis.
Then reflect over the line y=0.
Rotate 90° clockwise around the origin.
Then reflect over the line y=1.
Reflect over the x-axis.
Then translate by the rule (x, y)→(x−3,y+1)
Rotate 180° counter-clockwise around point (2, 1).
Then translate by the rule (x, y)→(x+2,y−1).

Answers: 1


Another question on Mathematics
Mathematics, 21.06.2019 13:00
Select all the correct statements. the amount in dollars an electrician charges in terms of the number of hours worked is represented by the function y = 22x + 42. from the function, identify all the phrases that hold true for the situation. the electrician charges an initial fee of $22 the y-variable represents the number of hours the electrician charges an initial fee of $42 the electrician charges $22 for every hour worked the x-variable represents the electricians charges in dollars the electrician charges $42 for every hour worked
Answers: 2
Mathematics, 21.06.2019 14:00
(a) calculate the molarity of a solution that contains 0.0345 mol nh4cl in 400 ml of solution. (b) how many moles of hno3 are present in 35.0 ml of a 2.20 m solution of nitric acid? (c) how many milliliters of 1.50 m koh solution are needed to supply 0.125 mil of koh ?
Answers: 2
Mathematics, 21.06.2019 16:30
An automated water dispenser fills packets with one liter of water on average, with a standard deviation of 5 milliliter. the manual says that after a year of operation the dispenser should be tested to see if it needs recalibration. a year later a number of filled packets are set aside and measured separately. it is found that the average packet now contains about 0.995 liters. does the dispenser need calibration? explain your answer.
Answers: 2
Mathematics, 21.06.2019 23:00
Each of the following data sets has a mean of x = 10. (i) 8 9 10 11 12 (ii) 7 9 10 11 13 (iii) 7 8 10 12 13 (a) without doing any computations, order the data sets according to increasing value of standard deviations. (i), (iii), (ii) (ii), (i), (iii) (iii), (i), (ii) (iii), (ii), (i) (i), (ii), (iii) (ii), (iii), (i) (b) why do you expect the difference in standard deviations between data sets (i) and (ii) to be greater than the difference in standard deviations between data sets (ii) and (iii)? hint: consider how much the data in the respective sets differ from the mean. the data change between data sets (i) and (ii) increased the squared difference îł(x - x)2 by more than data sets (ii) and (iii). the data change between data sets (ii) and (iii) increased the squared difference îł(x - x)2 by more than data sets (i) and (ii). the data change between data sets (i) and (ii) decreased the squared difference îł(x - x)2 by more than data sets (ii) and (iii). none of the above
Answers: 2
You know the right answer?
Which two sequential transformations would produce the image of the panda shown in the graph? Refere...
Questions


Computers and Technology, 11.12.2019 19:31

Mathematics, 11.12.2019 19:31
Mathematics, 11.12.2019 19:31
Mathematics, 11.12.2019 19:31


