
Mathematics, 05.03.2022 14:00 belferfex
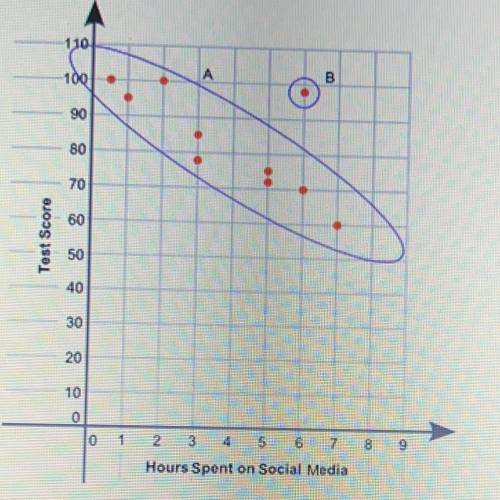
The scatterplot shows the relationship between the test scores of a group of students and the number of hours I spent on social media and a week:
Part A:
(1) What is the group of points labeled A called?
(2) What is the point labeled B called?
(3) Give a possible reason for the presence of point B

Answers: 1


Another question on Mathematics
Mathematics, 21.06.2019 19:20
1- is the product of two rational numbers irrational or rational? first, make a hypothesis by multiplying two rational numbers. then, use variables such as x=a/b and y=c/d and the closure property of integers to prove your hypothesis. 2- what do you think the product of a nonzero rational number and an irrational number is? is it rational or irrational? make use of variables, the closure property of integers, and possibly a proof by contradiction to prove your hypothesis. 3- why do we have to specify that the rational number must be nonzero when we determine what the product of a nonzero rational number and an irrational number is? if the rational number were 0, would it give us the same result we found in part b?
Answers: 3
Mathematics, 21.06.2019 19:50
Which inequality is equivalent to -3x < -12? x < 4 , x < -4 , x > 4, x > -4
Answers: 1
Mathematics, 21.06.2019 22:00
Type the correct answer in each box. spell all the words correctly, and use numerals instead of words for numbers. if necessary, use / for the fraction bar(s).
Answers: 1
Mathematics, 22.06.2019 02:00
1. the manager of collins import autos believes the number of cars sold in a day (q) depends on two factors: (1) the number of hours the dealership is open (h) and (2) the number of salespersons working that day (s). after collecting data for two months (53 days), the manager estimates the following log-linear model: q 4 equation 1 a. explain, how to transform the log-linear model into linear form that can be estimated using multiple regression analysis. the computer output for the multiple regression analysis is shown below: q4 table b. how do you interpret coefficients b and c? if the dealership increases the number of salespersons by 20%, what will be the percentage increase in daily sales? c. test the overall model for statistical significance at the 5% significance level. d. what percent of the total variation in daily auto sales is explained by this equation? what could you suggest to increase this percentage? e. test the intercept for statistical significance at the 5% level of significance. if h and s both equal 0, are sales expected to be 0? explain why or why not? f. test the estimated coefficient b for statistical significance. if the dealership decreases its hours of operation by 10%, what is the expected impact on daily sales?
Answers: 2
You know the right answer?
The scatterplot shows the relationship between the test scores of a group of students and the number...
Questions
Mathematics, 06.05.2020 05:00


Advanced Placement (AP), 06.05.2020 05:00

History, 06.05.2020 05:00

Mathematics, 06.05.2020 05:01

English, 06.05.2020 05:01
Biology, 06.05.2020 05:01
Mathematics, 06.05.2020 05:01
English, 06.05.2020 05:01
History, 06.05.2020 05:01


