Mathematics, 02.03.2022 20:10 Ashwaf23474
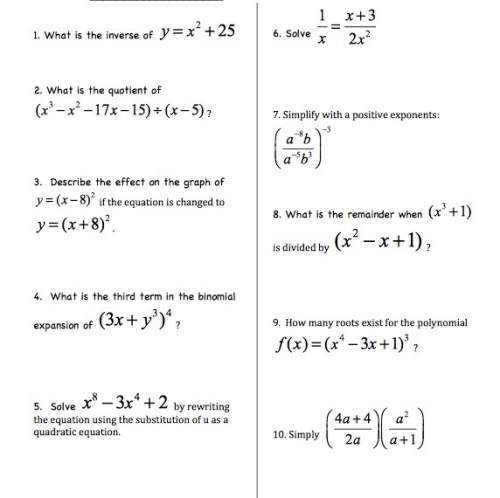
Let us continue identifying the Base rate and percentage In the given problem

Answers: 2


Another question on Mathematics

Mathematics, 21.06.2019 22:20
Which of the following describes how to translate the graph y = |x| to obtain the graph of y = |x+1|+1? shift 1 unit left and 1 unit down shift 1 unit left and 1 unit up shift 1 unit night and 1 unit down shift 1 unit nght and 1 unit up
Answers: 1

Mathematics, 22.06.2019 03:00
In a city, 6th and 7th avenues are parallel and the corner that the pizza palace is on is a 54° angle. what is the measure of the angle that is made with 7th ave and broadway on the corner of the shake hut?
Answers: 2

Mathematics, 22.06.2019 03:00
When you dilate a figure with a scale factor of 1/2, what will the dilated figure look like? a: the dilated figure will have side lengths that are half the length of the original side lengths. b: the angles in the dilated figure will be half the measure of the original figure. c: the dilated figure will have side lengths twice the length of the original.
Answers: 2

Mathematics, 22.06.2019 03:00
Describe how the presence of possible outliers might be identified on the following. (a) histograms gap between the first bar and the rest of bars or between the last bar and the rest of bars large group of bars to the left or right of a gap higher center bar than surrounding bars gap around the center of the histogram higher far left or right bar than surrounding bars (b) dotplots large gap around the center of the data large gap between data on the far left side or the far right side and the rest of the data large groups of data to the left or right of a gap large group of data in the center of the dotplot large group of data on the left or right of the dotplot (c) stem-and-leaf displays several empty stems in the center of the stem-and-leaf display large group of data in stems on one of the far sides of the stem-and-leaf display large group of data near a gap several empty stems after stem including the lowest values or before stem including the highest values large group of data in the center stems (d) box-and-whisker plots data within the fences placed at q1 â’ 1.5(iqr) and at q3 + 1.5(iqr) data beyond the fences placed at q1 â’ 2(iqr) and at q3 + 2(iqr) data within the fences placed at q1 â’ 2(iqr) and at q3 + 2(iqr) data beyond the fences placed at q1 â’ 1.5(iqr) and at q3 + 1.5(iqr) data beyond the fences placed at q1 â’ 1(iqr) and at q3 + 1(iqr)
Answers: 1
You know the right answer?
Let us continue identifying the Base rate and percentage In the given problem...
Questions


Mathematics, 26.03.2020 20:12


History, 26.03.2020 20:12


Physics, 26.03.2020 20:12


Mathematics, 26.03.2020 20:12


English, 26.03.2020 20:12


English, 26.03.2020 20:13


