subject
Mathematics, 20.02.2022 23:20 Rattley6223

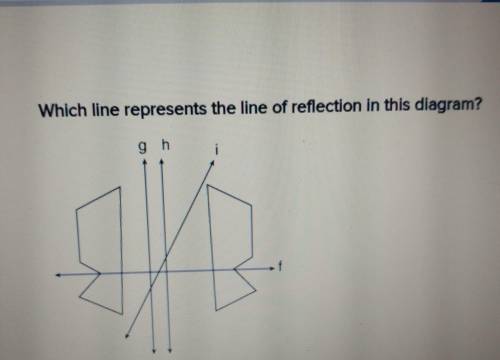
Which line represents the line of reflection in this diagram?
F
I
G
H


Which line represents the line of reflection in this diagram? FIGH

ansver
Answers: 3

Another question on Mathematics

question
Mathematics, 21.06.2019 21:30
(c) the diagram shows the first three shapes of a matchsticks arrangement.first shape = 3second shape = 5third shape = 7given m represents the number of matchstick used to arrange the n'th shape.(i) write a formula to represent the relation between m and n. express m as the subjectof the formula.(ii) 19 matchsticks are used to make the p'th shape. find the value of p.
Answers: 2
question
Mathematics, 21.06.2019 23:00
The equation represents the function f, and the graph represents the function g. f(x)=3(5/2)^x determine the relationship between the growth factors of f and g. a. the growth factor of g is twice the growth factor of f. b. the growth factor of f is twice the growth factor of g. c. the growth factor of f is 2.5 times the growth factor of g. d. the growth factor of f is the same as the growth factor of g.
Answers: 3
question
Mathematics, 22.06.2019 02:00
The equation y= -16t^2+120 can be used to represent the fridge height above the ground where ti represents time in seconds after she threw the apple how long does it take the apple to hit the ground running your
Answers: 3
question
Mathematics, 22.06.2019 02:30
According to a research study, parents with young children slept 6.4 hours each night last year, on average. a random sample of 18 parents with young children was surveyed and the mean amount of time per night each parent slept was 6.8. this data has a sample standard deviation of 0.9. (assume that the scores are normally distributed.) researchers conduct a one-mean hypothesis at the 5% significance level, to test if the mean amount of time parents with young children sleep per night is greater than the mean amount of time last year. the null and alternative hypotheses are h0: μ=6.4 and ha: μ> 6.4, which is a right-tailed test. the test statistic is determined to be t0=1.89 using the partial t-table below, determine the critical value(s). if there is only one critical value, leave the second answer box blank.
Answers: 3
You know the right answer?
Which line represents the line of reflection in this diagram?
F
I
G
H
Questions
question
Social Studies, 22.03.2021 08:20
question
Mathematics, 22.03.2021 08:20
question
Mathematics, 22.03.2021 08:20
question
History, 22.03.2021 08:20
question
Mathematics, 22.03.2021 08:20