Using Regressions to
Make Predictions
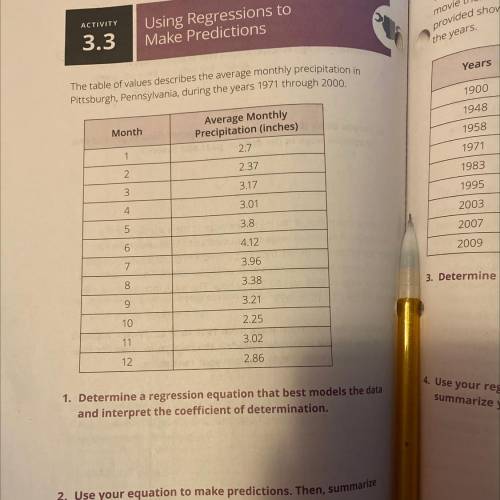
The table of values describes the average monthly prec...

Mathematics, 10.02.2022 22:30 marioagundis0998
Using Regressions to
Make Predictions
The table of values describes the average monthly precipitation in
Pittsburgh, Pennsylvania, during the years 1971 through 2000

Answers: 1


Another question on Mathematics
Mathematics, 21.06.2019 19:30
Cor d? ? me ? max recorded the heights of 500 male humans. he found that the heights were normally distributed around a mean of 177 centimeters. which statements about max’s data must be true? a) the median of max’s data is 250 b) more than half of the data points max recorded were 177 centimeters. c) a data point chosen at random is as likely to be above the mean as it is to be below the mean. d) every height within three standard deviations of the mean is equally likely to be chosen if a data point is selected at random.
Answers: 1
Mathematics, 21.06.2019 19:30
Which of the following describes the symmetry of the graph of y = x3?
Answers: 2
Mathematics, 21.06.2019 20:00
You wanted to draw an enlargement of design that printed on a card that is 4 in by 5
Answers: 1
Mathematics, 21.06.2019 22:00
Set up and solve a proportion for the following application problem. if 55 pounds of grass seed cover 404 square feet, how many pounds are needed for 7272 square feet?
Answers: 1
You know the right answer?
Questions


Mathematics, 03.02.2021 20:40

Mathematics, 03.02.2021 20:40

Social Studies, 03.02.2021 20:40

Mathematics, 03.02.2021 20:40
Mathematics, 03.02.2021 20:40


