
Mathematics, 17.01.2022 14:00 reginapokorny
The deflection temperature under load for two different types of plastic pipe is
being investigated. Two random samples of 15 pipe specimens are tested, and the
deflection temperatures observed are as follows (in Fahrenheit ):
Type 1: 206 188 205 191 194 193 207 185 189 213 192 210 194 198 205
Type 2: 177 197 206 200 180 176 185 200 197 192 198 188 189 203 192
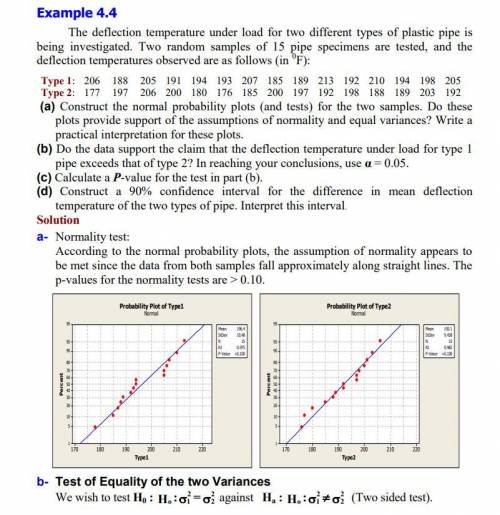
(a) Construct the normal probability plots (and tests) for the two samples. Do these
plots provide support for the assumptions of normality and equal variances? Write a
practical interpretation for these plots.
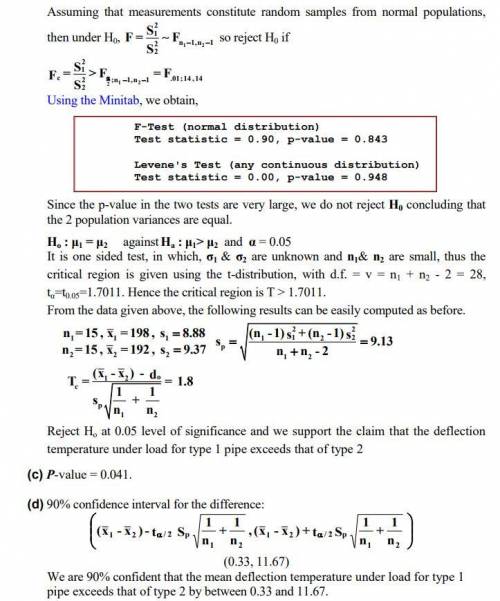
(b) Do the data support the claim that the deflection temperature under load for type 1
pipe exceeds that of type 2? In reaching your conclusions, use α = 0.05.
(c) Calculate a P-value for the test in part (b).
(d) Construct a 90% confidence interval for the difference in mean deflection
temperature of the two types of pipe. Interpret this interval.
My question is: how (b) is the test of the two variances? I don't understand this point

Answers: 2


Another question on Mathematics
Mathematics, 21.06.2019 15:30
Jordan rides his bike 6 7/15 miles every day to deliver newspapers and to go to and from school. if his ride to and from school is 4 3/10 miles, how many miles is the trip to deliver newspapers? 1 1/3 1 1/6 2 1/6 2 4/5
Answers: 1
Mathematics, 21.06.2019 15:30
Astore manager records the total visitors and sales, in dollars, for 10 days. the data is shown in the scatter plot. what conclusion can the store manager draw based on the data? question 3 options: an increase in sales causes a decrease in visitors. an increase in sales is correlated with a decrease in visitors. an increase in visitors is correlated with an increase in sales.
Answers: 1
Mathematics, 21.06.2019 19:30
The table below represents the displacement of a fish from its reef as a function of time: time (hours) x displacement from reef (feet) y 0 4 1 64 2 124 3 184 4 244 part a: what is the y-intercept of the function, and what does this tell you about the fish? (4 points) part b: calculate the average rate of change of the function represented by the table between x = 1 to x = 3 hours, and tell what the average rate represents. (4 points) part c: what would be the domain of the function if the fish continued to swim at this rate until it traveled 724 feet from the reef? (2 points)
Answers: 2
Mathematics, 21.06.2019 21:40
Use sigma notation to represent the following series for 9 terms.
Answers: 2
You know the right answer?
The deflection temperature under load for two different types of plastic pipe is
being investigate...
Questions
Mathematics, 31.08.2021 18:30

English, 31.08.2021 18:30


Mathematics, 31.08.2021 18:30

English, 31.08.2021 18:30
Mathematics, 31.08.2021 18:30

Mathematics, 31.08.2021 18:30


Biology, 31.08.2021 18:30


