
Mathematics, 06.01.2022 05:30 madisonreynolds2208
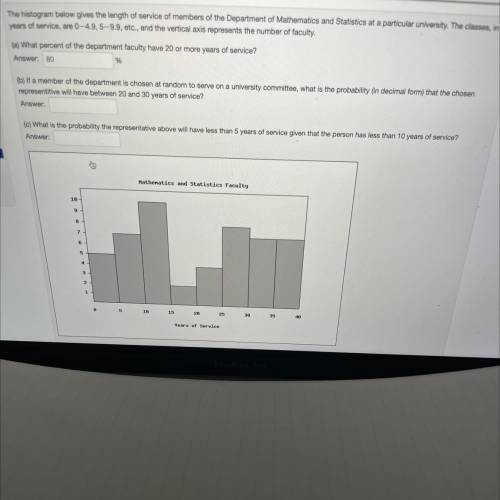
The histogram below gives the length of service of members of the Department of Mathematics and Statistics at a particular university. The classes, in
years of service, are 0-4.9,5-9.9, etc., and the vertical axis represents the number of faculty.
(a) What percent of the department faculty have 20 or more years of service?
80
%
(5) If a member of the department is chosen at random to serve on a university committee, what is the probability in decimal form) that the chosen
representitive will have between 20 and 30 years of service?
(c) What is the probability the representative above will have less than 5 years of service given that the person has less than 10 years of service?
Hathenatics and Statistice Faculty
10 -
9
B
7
6
5
10
15
20
25
30
35
Years of Service

Answers: 3


Another question on Mathematics
Mathematics, 21.06.2019 13:30
If jm equals 5x -8 and lm equals 2x -6 which expression represents jl
Answers: 1
Mathematics, 21.06.2019 15:10
Which of the following is a justification used while proving the similarity of triangles lom and mon
Answers: 1
Mathematics, 21.06.2019 21:00
Rewrite the following quadratic functions in intercept or factored form. show your work. y = 9 + 12x + 4x^2
Answers: 2
Mathematics, 21.06.2019 21:00
Kira looked through online census information to determine the overage number of people living in the homes in her city what is true about kira's data collection?
Answers: 1
You know the right answer?
The histogram below gives the length of service of members of the Department of Mathematics and Stat...
Questions


English, 15.04.2021 23:50

Social Studies, 15.04.2021 23:50

Mathematics, 15.04.2021 23:50

Mathematics, 15.04.2021 23:50
Mathematics, 15.04.2021 23:50
Mathematics, 15.04.2021 23:50
Mathematics, 15.04.2021 23:50
English, 15.04.2021 23:50

Mathematics, 15.04.2021 23:50


