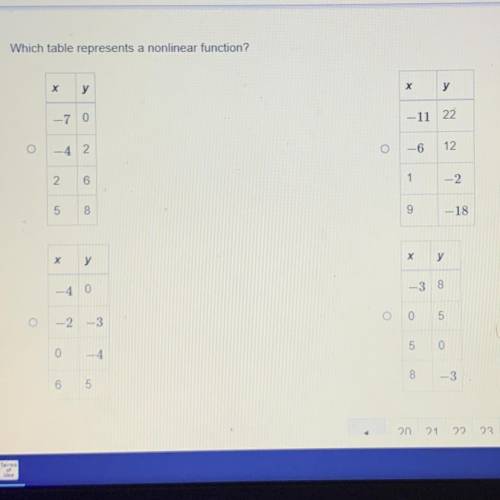
bottom left choice
Step-by-step explanation:
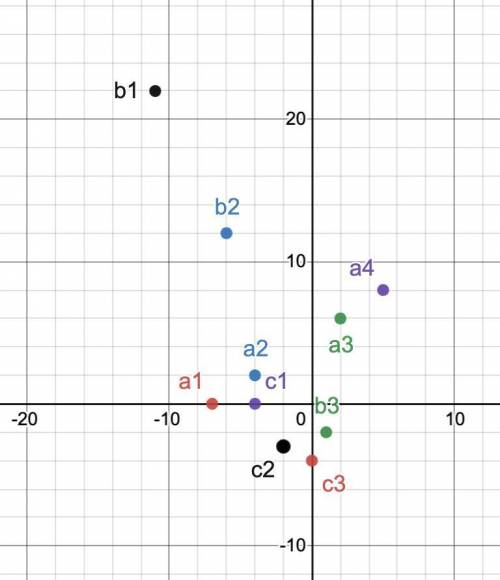
use desmo lol. but u can just find the slope of each one and see if it is linear or not. here is the pic:
note: a1, a2, a3, a4 is the top left one, b1, b2, b3 is the top right, c1, c2, c3 is the bottom left.
hope it helps. maybe u have to visualize the graph by connecting the points