
Mathematics, 30.11.2021 23:20 leriscepowell3654
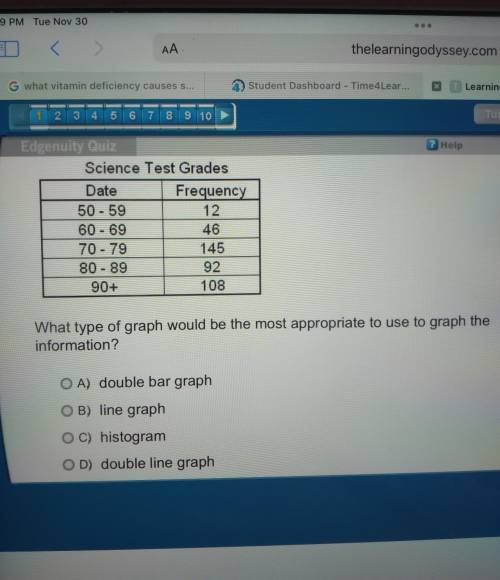
The survey below shows the science test grades from one state. Science Test Grades Date Frequency 50-59 12 60 - 69 46 70 - 79 145 80 - 89 92 90+ 108 - What type of graph would be the most appropriate to use to graph the information?

Answers: 3


Another question on Mathematics
Mathematics, 21.06.2019 17:00
Let f(x)=2x and g(x)=2x. graph the functions on the same coordinate plane. what are the solutions to the equation f(x)=g(x) ?me asap
Answers: 2
Mathematics, 21.06.2019 19:20
The suare root of 9x plus 7 plus the square rot of 2x equall to 7
Answers: 1
You know the right answer?
The survey below shows the science test grades from one state. Science Test Grades Date Frequency 50...
Questions

Chemistry, 01.12.2020 14:00


Chemistry, 01.12.2020 14:00
Mathematics, 01.12.2020 14:00
Mathematics, 01.12.2020 14:00
Mathematics, 01.12.2020 14:00
Biology, 01.12.2020 14:00
Mathematics, 01.12.2020 14:00

Computers and Technology, 01.12.2020 14:00
Mathematics, 01.12.2020 14:00
Biology, 01.12.2020 14:00

Spanish, 01.12.2020 14:00

Mathematics, 01.12.2020 14:00

History, 01.12.2020 14:00
Social Studies, 01.12.2020 14:00


