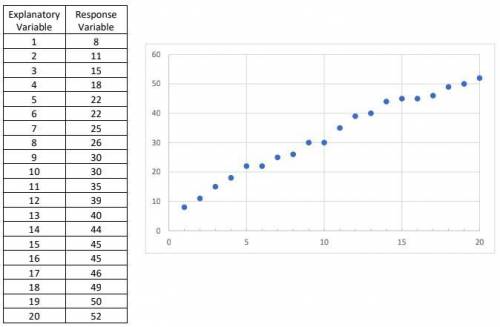
A researcher collected the following bivariate data.
(Shown in image below)
Part A Craft a s...

Mathematics, 04.11.2021 14:00 kendrabrown41
A researcher collected the following bivariate data.
(Shown in image below)
Part A Craft a scenario that could be modeled by this set of data. You will be using this scenario to answer the rest of this question. (8 points)
Part B Calculate and interpret the value of the Coefficient of Determination and Correlation Coefficient. (8 points)
Part C Using the context you identified in Part A, comment on the association between these two variables. (8 points)
Part D Write the equation of the least-squares regression line for these data. Be sure to clearly define your variables, using the context from Part A. (8 points)
Part E Find the residual value for x = 16. Interpret this value in the context you identified in Part A. (8 points)

Answers: 1


Another question on Mathematics
Mathematics, 21.06.2019 14:30
Its due ! write an equation in which the quadratic expression 2x^2-2x 12 equals 0. show the expression in factored form and explain what your solutions mean for the equation. show your work.
Answers: 1
Mathematics, 21.06.2019 15:00
Suppose a ball is dropped fromca height of 6ft. it bounces back up but time it bounces, it reaches only 7/10 of its pervious height. what is the total of each height that the ball reaches after 5 bounces
Answers: 1
Mathematics, 21.06.2019 19:00
Find the equation of a line whose slope is 2/5 and y- intercept is 2.write your answer in the form 1) ax+by+c=02) x/a+y/b=1
Answers: 1
You know the right answer?
Questions
Mathematics, 19.02.2021 01:30


English, 19.02.2021 01:30

History, 19.02.2021 01:30

Computers and Technology, 19.02.2021 01:30

Biology, 19.02.2021 01:30
Biology, 19.02.2021 01:30
History, 19.02.2021 01:30

Mathematics, 19.02.2021 01:30
Mathematics, 19.02.2021 01:30
Mathematics, 19.02.2021 01:30


