
Mathematics, 30.10.2021 23:10 jgandarilla21
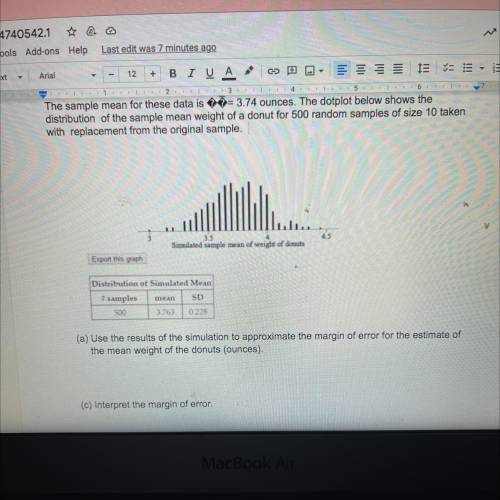
The sample mean for these data is = 3.74 ounces. The dotplot below shows the
distribution of the sample mean weight of a donut for 500 random samples of size 10 taken
with replacement from the original sample.
tr...
25
35
Simulated sample mean of weight of donuts
Export this graph
Distribution of Simulated Mean
# samples mean
SD
500 3.763 0.228
(a) Use the results of the simulation to approximate the margin of error for the estimate of
the mean weight of the donuts (ounces).
(c) Interpret the margin of error.

Answers: 3


Another question on Mathematics
Mathematics, 21.06.2019 14:50
Apair of ordinary dice is rolled. what is the probability that each die will show a number higher than 4. 1. (1/36) 2. (1/12) 3. (1/6) 4. (1/4) 5. (1/3)
Answers: 2
Mathematics, 21.06.2019 16:00
The level of co2 emissions, f(x), in metric tons, from the town of fairfax x years after they started recording is shown in the table below. x 2 4 6 8 10 f(x) 26,460 29,172.15 32,162.29 35,458.93 39,093.47 select the true statement.
Answers: 1
Mathematics, 21.06.2019 23:00
The weight of a radioactive isotope was 96 grams at the start of an experiment. after one hour, the weight of the isotope was half of its initial weight. after two hours, the weight of the isotope was half of its weight the previous hour. if this pattern continues, which of the following graphs represents the weight of the radioactive isotope over time? a. graph w b. graph x c. graph y d. graph z
Answers: 2
Mathematics, 21.06.2019 23:00
Agroup of three friends order a combo meal which includes two slices of pizza and a drink each drink is priced at $2.50 the combined total of $31.50 how much is the cost of a slice of pizza
Answers: 2
You know the right answer?
The sample mean for these data is = 3.74 ounces. The dotplot below shows the
distribution of the s...
Questions

History, 05.07.2019 14:30

English, 05.07.2019 14:30

English, 05.07.2019 14:30

Biology, 05.07.2019 14:30
History, 05.07.2019 14:30
History, 05.07.2019 14:30
English, 05.07.2019 14:30


Social Studies, 05.07.2019 14:30

Biology, 05.07.2019 14:30


