8

Mathematics, 30.10.2021 19:20 taylorbohr6823
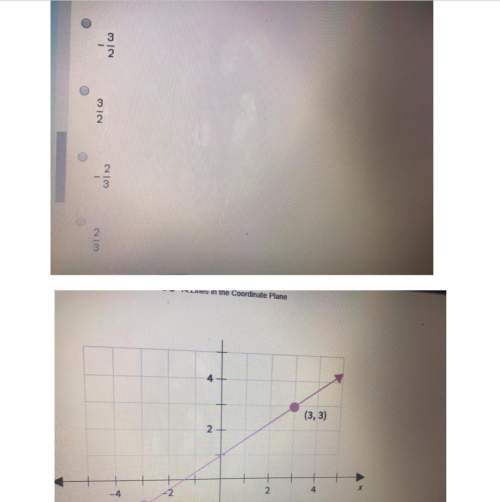
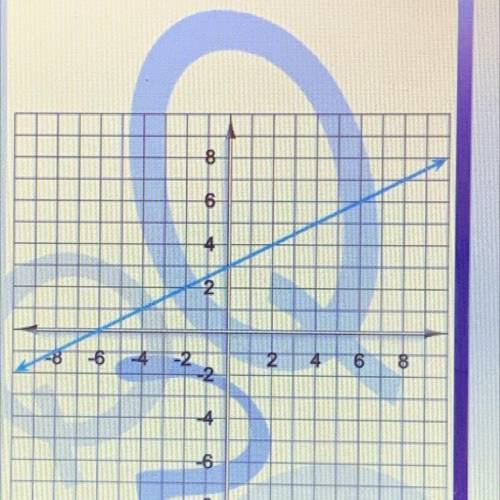
Here's a graph of a linear function. Write the
equation that describes that function.
8
Express it in slope-intercept form.
6
Enter the correct answer.
4
000
DONE
2
Clear all
ĐOO
-
-2
4
6
4
-6
-8

Answers: 2


Another question on Mathematics
Mathematics, 21.06.2019 21:30
Ahypothesis is: a the average squared deviations about the mean of a distribution of values b) an empirically testable statement that is an unproven supposition developed in order to explain phenomena a statement that asserts the status quo; that is, any change from what has been c) thought to be true is due to random sampling order da statement that is the opposite of the null hypothesis e) the error made by rejecting the null hypothesis when it is true
Answers: 2
Mathematics, 22.06.2019 01:20
Do one of the following, as appropriate: (a) find the critical value z subscript alpha divided by 2 , (b) find the critical value t subscript alpha divided by 2 . 99%; nequals 17; sigma is unknown; population appears to be normally distributed.
Answers: 3
Mathematics, 22.06.2019 01:40
The tree filled 3/4 of a cup in 1/2 and hour at what rate does syurup flow from the tree
Answers: 1
Mathematics, 22.06.2019 02:00
1. the manager of collins import autos believes the number of cars sold in a day (q) depends on two factors: (1) the number of hours the dealership is open (h) and (2) the number of salespersons working that day (s). after collecting data for two months (53 days), the manager estimates the following log-linear model: q 4 equation 1 a. explain, how to transform the log-linear model into linear form that can be estimated using multiple regression analysis. the computer output for the multiple regression analysis is shown below: q4 table b. how do you interpret coefficients b and c? if the dealership increases the number of salespersons by 20%, what will be the percentage increase in daily sales? c. test the overall model for statistical significance at the 5% significance level. d. what percent of the total variation in daily auto sales is explained by this equation? what could you suggest to increase this percentage? e. test the intercept for statistical significance at the 5% level of significance. if h and s both equal 0, are sales expected to be 0? explain why or why not? f. test the estimated coefficient b for statistical significance. if the dealership decreases its hours of operation by 10%, what is the expected impact on daily sales?
Answers: 2
You know the right answer?
Here's a graph of a linear function. Write the
equation that describes that function.
8
8
Questions

Social Studies, 06.02.2021 06:20

Computers and Technology, 06.02.2021 06:20

Chemistry, 06.02.2021 06:20
Mathematics, 06.02.2021 06:20
Mathematics, 06.02.2021 06:20
Computers and Technology, 06.02.2021 06:20


Mathematics, 06.02.2021 06:20
Mathematics, 06.02.2021 06:20
Mathematics, 06.02.2021 06:20
Mathematics, 06.02.2021 06:20


